


Key Takeaways:
- USD/JPY technical strategy: breakout above 200-DMA/ trendline could signal breakout
- 200-DMA (112.195) and 2017 falling trendline acting as key resistance on move
- IGCS Highlight: Drop in net-long exposure favors contrarian via of upside
A textbook definition of a downtrend is a series of lower lows and lower highs on the chart and time frame you’re following. The question is, when does a lower high break higher and thus signal a changing of a trend from lower to higher? USD/JPY is at a potential breaking point such that if the downtrend remains, here is a great place for the market to turn. Highly correlated markets like the US Treasury 10Yr Yields (overlaid as a line on the chart below) are also at a seeming turning point.
The key point on the chart of USD/JPY is that the price pattern is that of a wedge. Wedges tend to indicate big moves on the horizon. However, the direction of the move is less certain. A similar wedge pattern is developing in UST 10Yr Yields. The direction of the wedge is lower since the double top in yields from late 2016, early 2017 at the 2.62 level.
The USD/JPY chart did not post a similar double-top, and in fact, was a helpful tell that there was an underlying weakness in the second move higher in US Yields as JPY strength kept a lid on USD/JPY appreciation. We’re at a similar point where both markets are pushing to resistance, and the next move higher or lower could dictate the market, as well as overall risk-sentiment going forward.
From a fundamental perspective, the markets await FOMC, which is unlikely to surprise in a hawkish given uneven data prints in the US. A more dovish than anticipated Fed would motivate the broader USD selling trend and likely send USD/JPY lower. In Japan, the focal events are the BoJ and the Lower House election, which is not expected to directly affect the JPY due to the recent subdued JPY price volatility.
The most Bullish development would be a daily close above the Ichimoku Cloud (ceiling is at yesterday’s close), and the 200-DMA (aligning with the 2017 trendline). The zone of this resistance is 111.60-112.20. This 60 pip zone could act as strong resistance. A break above this zone would favor a move to the 2017 resistance point of 114/5. A failure to breakout from here could usher in a wave of treasury buying (lower yields), and JPY strength. This bearish development would be best confirmed on the move back below 110 on a daily close basis.
Daily USD/JPY Chart: Strong resistance into 111.60/112.20 Zone (Ichimoku + 200-DMA)
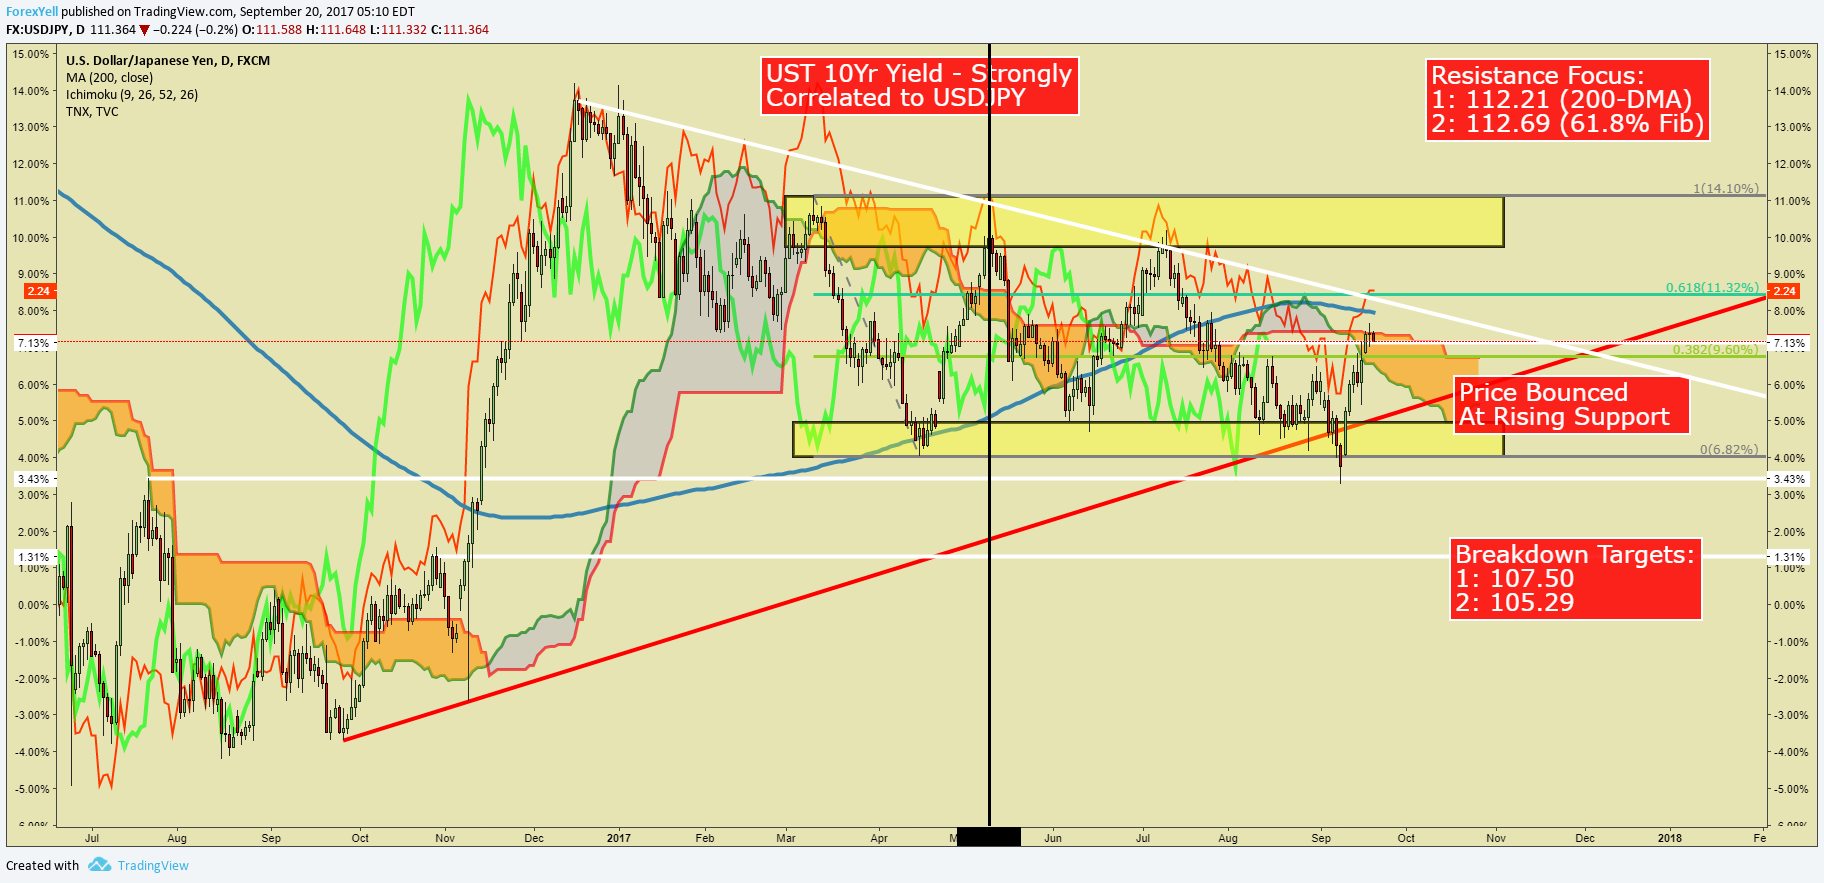
Chart Created by Tyler Yell, CMT
USD/JPY Insight from IG Client Positioning: Drop in net-long exposure favors reversal higher
The sentiment highlight section is designed to help you see how DailyFX utilizes the insights derived from IG Client Sentiment, and how client positioning can lead to trade ideas. If you have any questions on this indicator, you are welcome to reach out to the author of this article with questions at tyell@dailyfx.com.
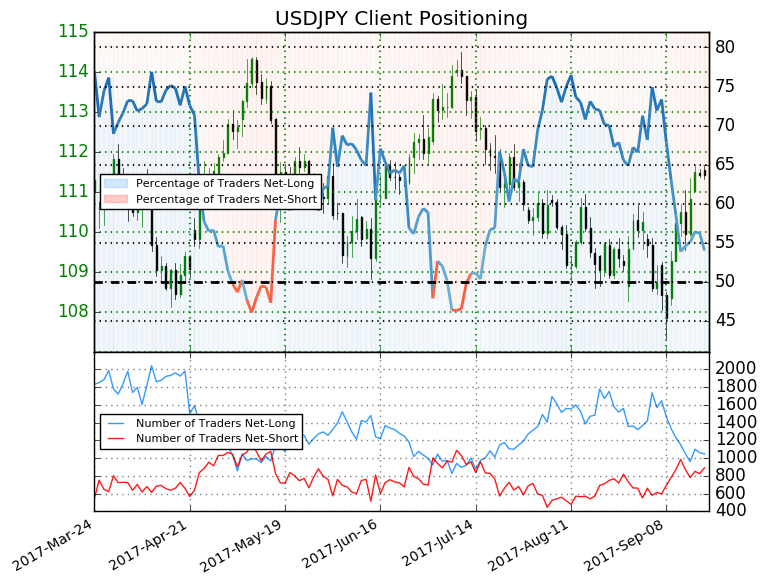
USDJPY: Retail trader data shows 66.2% of traders are net-long with the ratio of traders long to short at 1.96 to 1. In fact, traders have remained net-long since Jul 18 when USDJPY traded near 114.057; the price has moved 4.2% lower since then. The number of traders net-long is 5.5% lower than yesterday and 5.2% higher from last week, while the number of traders net-short is 14.5% higher than yesterday and 4.4% higher from last week.
We typically take a contrarian view to crowd sentiment, and the fact traders are net-long suggests USDJPY prices may continue to fall. Positioning is less net-long than yesterday but more net-long from last week. The combination of current sentiment and recent changes gives us a further mixed USDJPY trading bias (emphasis added.)
---
Written by Tyler Yell, CMT, Currency Analyst & Trading Instructor for DailyFX.com
To receive Tyler's analysis directly via email, please SIGN UP HERE
Contact and discuss markets with Tyler on Twitter: @ForexYell


