Talking Points:
- USD/JPY Technical Strategy: consolidation favors eventual continuation higher
- Japan’s Chief Cabinet Secretary Yoshihide Suga renews Currency War rhetoric
- USD/JPY Pattern Appears Incomplete to the Upside (Webinar)
The Japanese Yen has halted its decline against the USD as 2016 comes to a close. However, since September 21, when the Bank of Japan announced the significance Yield Curve Control policy or YCC, USD/JPY has now risen by as much as ~19.35% and could continue higher into 2017 given a recent message from Japan’s Chief Cabinet Secretary Yoshihide Suga in a Nikkei News Interview.
The interview from Shinzo Abe’s ‘right-hand’ turned focus on the FX market as one the most critical crisis managements for his post as Chief Cabinet Secretaryis the FX market. Specifically, his focus was on creating a stable financial and economic environment for Japanese corporations so they could borrow and grow within a stable environment.
However, it’s fair to say that the near 16% JPY weakness fails to provide stability sought by Japan’s government. Much of the move in USD/JPY has been on the November Trump victory, which is playing out in financial markets similar to the December 16, 2012, Japan election that gave Shinzo Abe’s Liberal Democratic Party in addition to the hawkish rhetoric from the Federal Reserve on December 14.
D1 USD/JPY Chart: USD/JPY Sitting At Strong Trend Support (9-Day Midpoint)
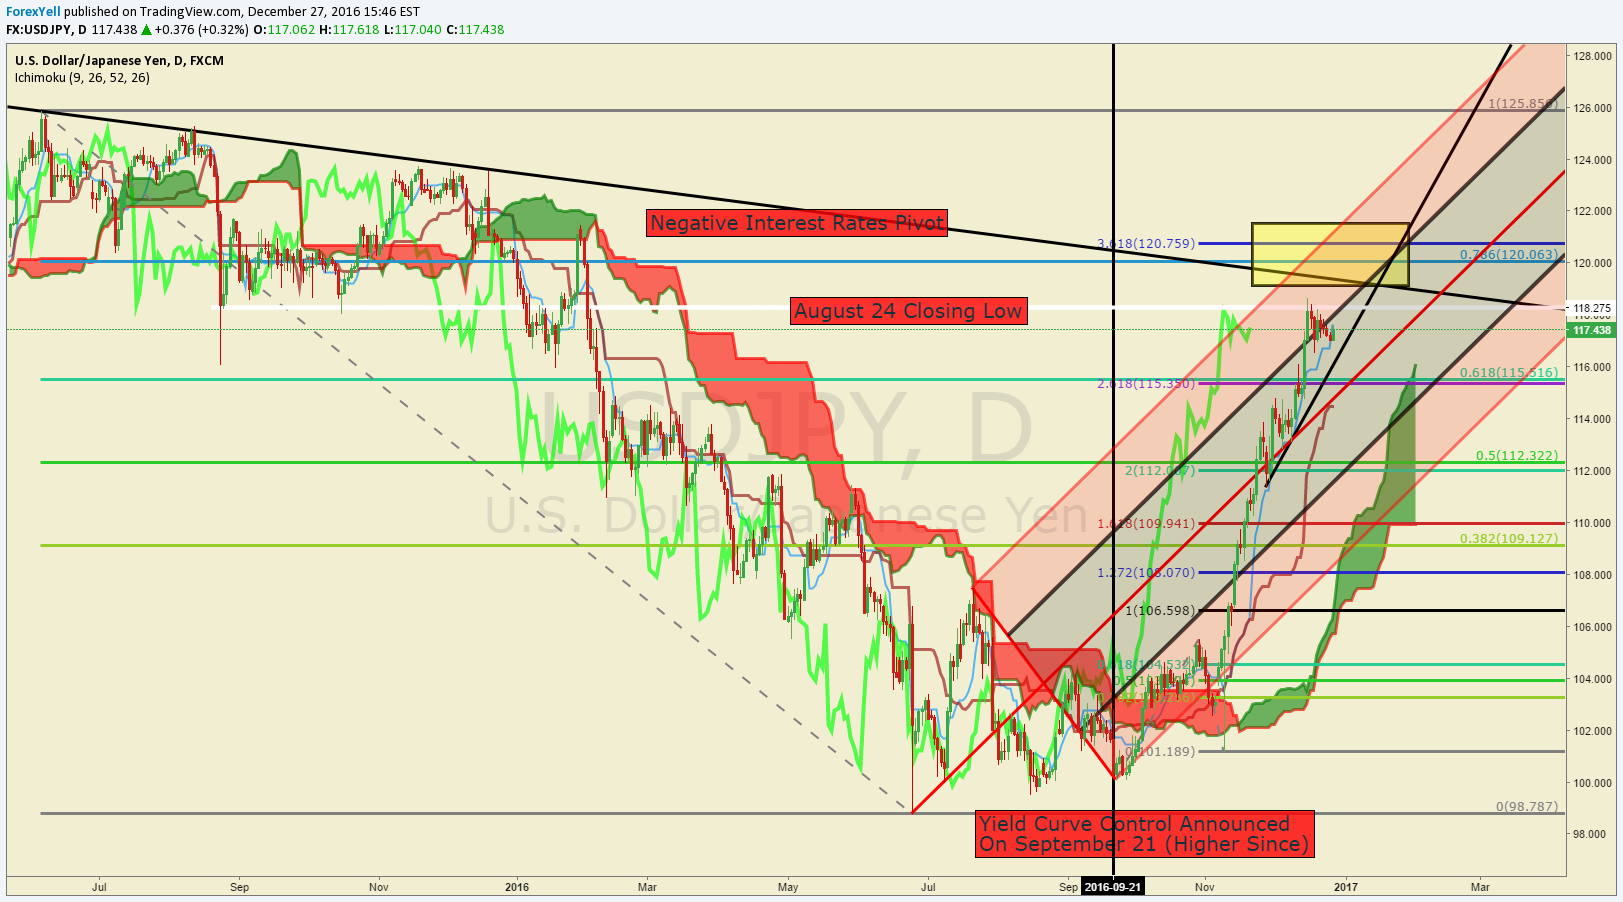
Chart Created by Tyler Yell, CMT, Courtesy of TradingView
The Technical Picture has not changed for USD/JPY as the uptrend looks ready to resume its uptrend at the start of 2017. The zone of support worth watching in this strong uptrend is the December 19 low of 116.56 and the August 24, 2015, low of 116.08. This zone also encompasses a Trendline drawn from higher lows that began with the 111.35 low on November 28.
The resistance worth watching and we anticipate being hit begins with the August 24, 2015, close of 118.275 as well as the confluence of resistance that combines the Trendline off of intraday highs going back to the June 2015 high of 125.85 as well as Fibonacci expansions that extend toward 120.759.
The final upward resistance worth watching over coming weeks should USD strength, or JPY weakness continue isthe 2016 intra-day high that took place on January 29 when the Bank of Japan introduced negative interest rates. While the initial announcement led to a high of 121.627, the JPY would go on to strengthen by over 20% in the following months.
The price pattern that is better seen on an intraday chart shows a consolidation sideways above previously mentioned support at 116.56 would place preference on further upside if the price does not break below 116.56. Additionally, momentum is remaining bullish per RSI(5) on a daily chart that sits above the 50 level.
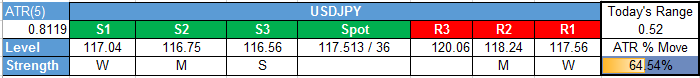
Shorter-Term USD/JPY Technical Levels: December 27, 2016
For those interested in shorter-term levels of focus than the ones above, these levels signal important potential pivot levels over the next 48-hours.