


Talking Points:
- USD/JPY Technical Strategy: Bullish Break > Structural Resistance Encouraging
- Bank of Japan chooses “yield curve control,” they may have changed the game of QE
- Long-term trend continuation may be in play as USD resumes dormant uptrend
Access Our Free Q4 Trading Guides That Focus On Tradeable Themes Here
After the London Fix on Wednesday, USD/JPY did a mini-moon shoot toward and through key resistance. The strong move came ahead of FOMC minutes for the September 21 Fed meeting where three voters dissented and voted for a rate hike. For multiple reasons, we’ve seen a very strong USD in October, and USD/JPY is a key benefactor of the move.
In our last note, we discussed how the Chinese Renminbi (off-shore Yuan) fell by its largest amount in four months after China opened following National Day Golden Week holiday and continued to drop against USD. The drop continues to validate the trend of a stronger USD and weaker CNH. The weakening took the Yuan to its lowest level (6.7501) since September 2010 according to Bloomberg data. The significance of the CNY move to six-year lows is what it may encourage Japan to do that would also weaken the JPY (i.e. yield curve control + fiscal stimulus), and therefore encourage an impressive set-up for a long USD/JPY trade (not a trade recommendation.)
4-Year USD/JPY Chart Shows Bounce Off Support, Resistance In View
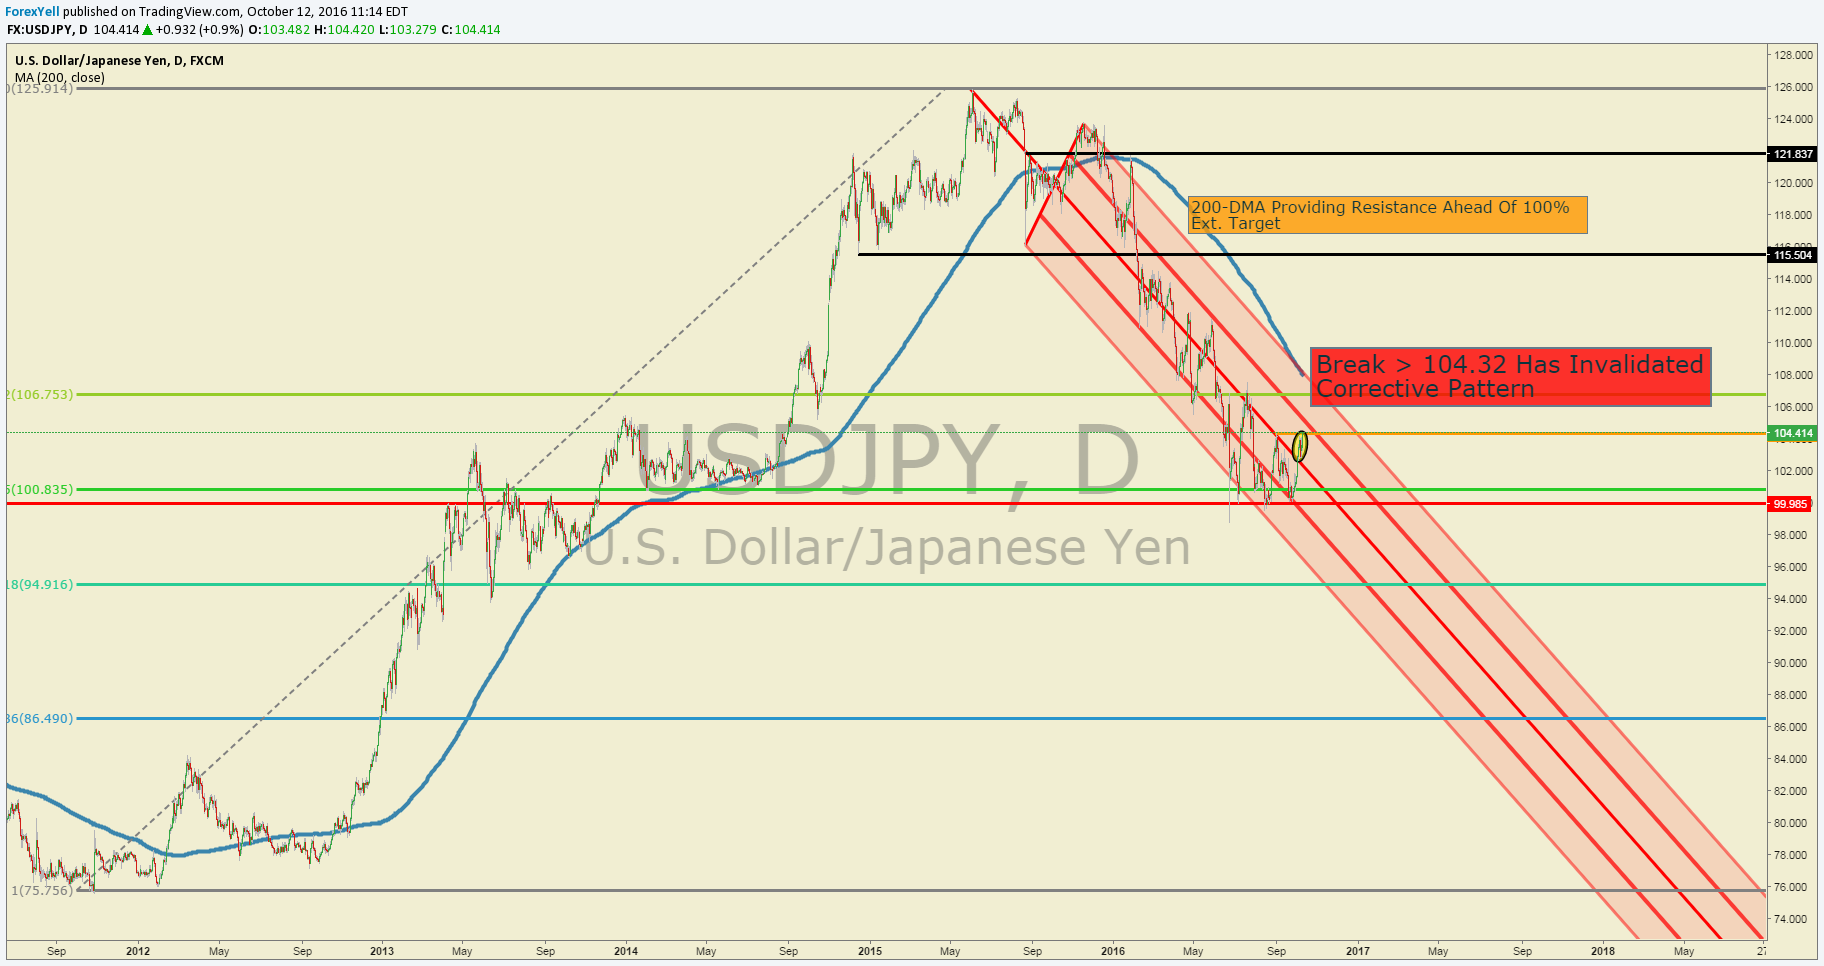
Chart Created by Tyler Yell, CMT, Courtesy of TradingView
The long-term chart shows USD/JPY moving higher after oscillating above 100 for a handful of months. The stagnation of price near 100 also occurred with rising slow stochastics, which could make the argument for bullish divergence on a daily USDJPY chart.
Additionally, you will see that the recent move higher (though we’re not out of a downtrend yet), happened near the kick-off point in July 2014 and the 50% retracement of the 2011-2015 price range. While we have bullish targets ahead of 105 and 108 (200-DMA & upper median line of the bearish Andrew’s Pitchfork,) it’s foolish to assume the downtrend is definitively over.
USD/JPY Accelerates Through 104.32 Invalidating Bearish Corrective Pattern

Chart Created by Tyler Yell, CMT Courtesy of Trading View
Looking above, you can see what appears to be a very clear downtrend as highlighted by Andrew’s Pitchfork (Red). The long-term trend shows the path of least resistance, but it is worth being watchful for signs of a trend change that may be developing. The move above the 100-DMA (103.67) and the basing above Ichimoku Cloud on the chart above preceded the break above structural triangle resistance at 104.32. These three bullish moves with price above 100-DMA, Ichimoku, and now the triangle invalidation helps paint the scene for green shoots of a bullish development.
When looking for a reversal of a year-plus-long trend, it’s helpful to take a page out of Bayesian probability that looks for moments of proof of the pending hypothesis that the trend is turning. In other words, utilizing a few scenarios that would validate the trend change, which is a rare event. Now that 104.32 has broken, the next key zone to confirm a breakout would be ~107.50/108.10. These two levels encompass the July/ post-Brexit high and the 200-DMA respectively.
In previous market notes, we’ve discussed how Ichimoku Cloud would be one of the first long-term indicators to register a Bullish signal on a break and close above 103.20 on the daily chart. We seem to have that, but now the focus will be on carry through above 104.32 to see if a breakout is underway.
Lastly, the recent breakout has taken out the opening range high of October at 104.15. The break above the high of 104.15 on a closing basis should further embolden USD/JPY bulls. A continuation through the resistance levels mentioned above could see traders start to push USD/JPY higher in fear of missing out on the next USD/JPY long trade.
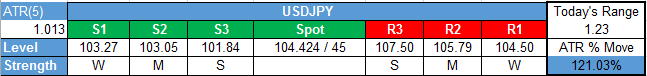
Shorter-Term USD/JPY Technical Levels: October 12, 2016
For those interested in shorter-term levels of focus than the ones above, these levels signal important potential pivot levels over the next 48-hours.
Access Free Real-Time News Coverage and Strategy Sessions in Our Live Trading Room


