USD/JPY Talking Points:
-USD/JPY Technical Strategy: Sideways Consolidation is Clarified on Hourly Chart
-Price Pattern: Triangle Corrective Move within Uptrend, Favors Trend Resumption
-US DOLLAR Finding Technical Support Could Help Fund Breakout
Changing timeframes can help traders see a trading opportunity that may not have existed or have been detectable on another timeframe. USD/JPY is an example of a currency pair where the daily chart looks to confuse, but the hourly chart can enlighten. The US dollar finished lower against a majority of its counterparts over the last week save the Japanese Yen. Other currencies like the New Zealand Dollar and Euro had their way with the Yen, and if US Dollar strength continues we could see a similar fate for USDJPY.
Would You Like To See How Other Traders Are Positioned in Key Currencies? If so, Click Here
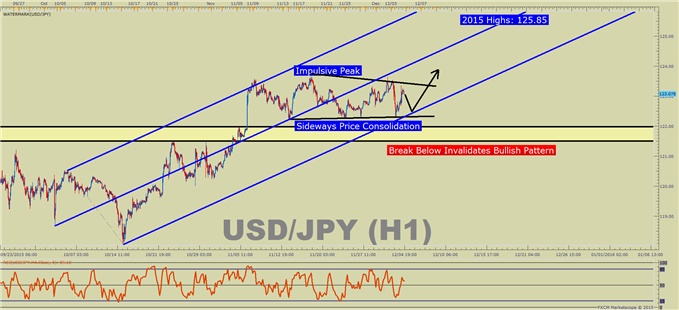
The chart below shows you an hourly chart of the USD/JPY from the October 15th low. After the low, USD/JPY made a 550 pip move before running into resistance near 124. However, what’s critical to point out is that price broke above key resistance going back to mid-August, and the price has held above that level in the recent bout of US Dollar weakness. If you’d like to see a longer-term chart of USD/JPY click here. A sideways consolidation often denotes strength in the underlying trend. In the case of USD/JPY, the underlying trend is higher. The trick with sideways consolidations is knowing or getting a feel for when they will breakout. With nearly a decade of experience, I can tell you that sideways consolidations nearly always last longer than many expect. Because they last so long, it’s often best to set an entry order with risk limits attached and forget until triggered.
If a trader were willing to take that approach, they could look to the mid-to-late November highs of 123.65. A break above 123.66 would turn the focus towards the 2015 high of 125.85 with a likelihood of pushing much higher should US Dollar momentum continue. The risk on the trade would be below the current price support of 122.25, the November 15th low. If that level breaks, it would be unfavorable to expect new highs with multi-week support breaking. Another encouraging sign that the bullish channel (blue lines) will hold is that sentiment is nearing a ‘buy signal.' Long positions are 10.4% lower than yesterday and 28.4% below levels seen last week. Short positions are 7.2% higher than yesterday.The trading crowd has grown less net-long from yesterday and last week, and as a contrarian indicator, any price breakout could take us back to the top of the price channel again, which would likely bring new 2015 highs. T.Y.