Talking Points:
- USD/JPY Technical Strategy: USDJPY Continues to Hold Key Support at 122, Favoring Upside
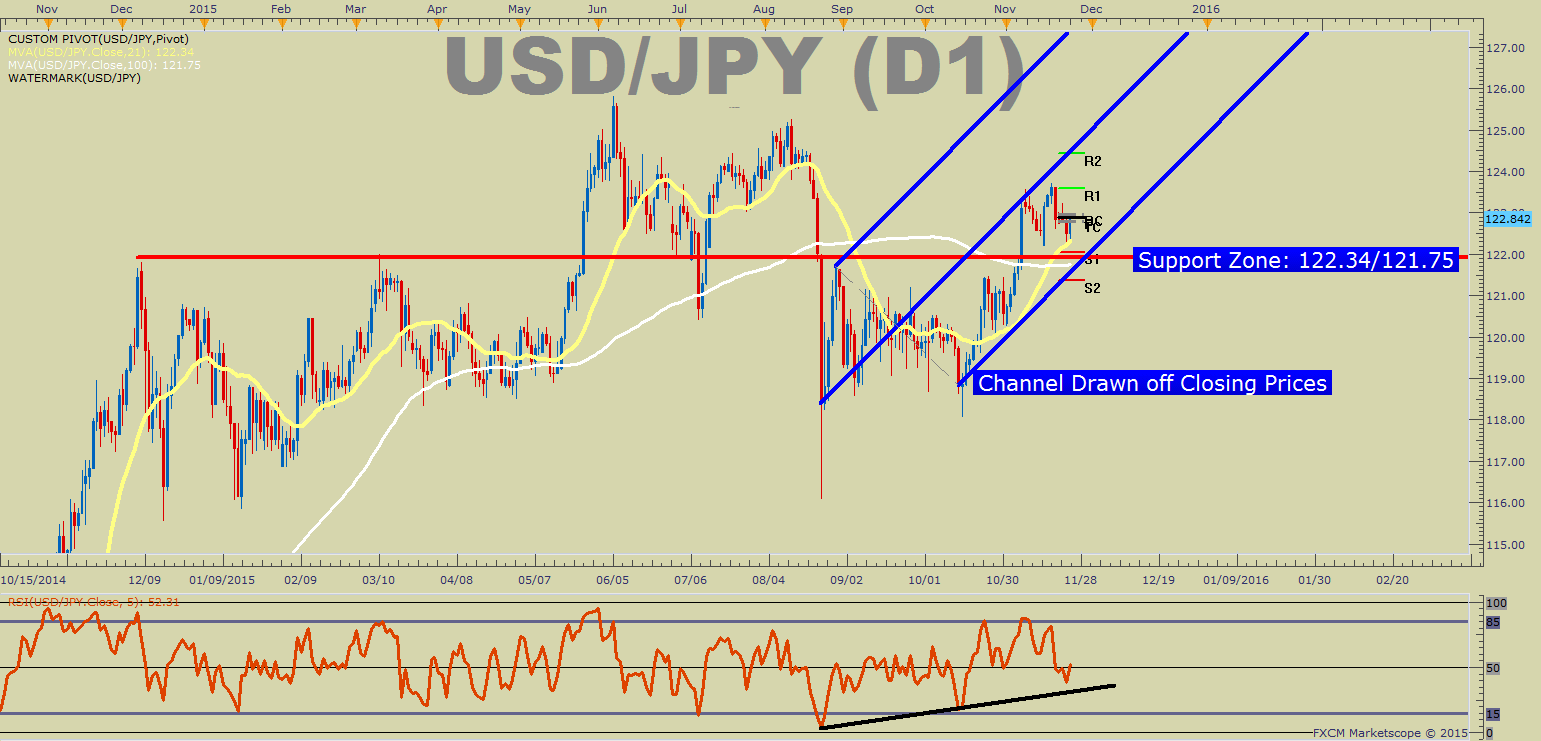
-21-DMA & 100-DMAsupport under threat at 122.34/121.75
-Environment for JPY Strength Is Heating Up But Is Not Without Opposition
The Japanese Yen is unlikely to gain a foothold in G10FX without a true risk-off event or shake-up of the current paradigm of central bank-led markets. Yesterday, we got a taste of the risk-off environment as a Russian plane was taken down by Turkish Military on the Turkey/ Syria border. A few threats from Putin later, and the JPY continued to strengthen, along with WTI Crude Oil. However, risk sentiment as shown by the market-mood barometer of the SPX500 remains healthy as we sit around the 2,100 level. USDJPY & SPX500 tend toward positive correlation and because both lean toward risk-sentiment, the SPX500 being within 2% of all-time highs are understandingly convincing people not to hit the panic button just yet. To newer traders, the panic button in FX and buying JPY are nearly synonymous.
A great zone to focus on right now is the 21-day moving average and 100-day moving average because they align with major technical levels. First, the 21-day moving average, which is roughly a month’s worth of trading days sits around 122.30 and is near today’s low as well as last week’s low. A daily close below the 21-day moving average would lead traders to focus on the 100-day moving average at 121.75 that also encapsulates the late August high as well as the December ’14 and March highs. Should price break below these levels on USDJPY, there could either be larger JPY strength, which could open up other trade ideas like AUDJPY or GBPJPY, or the US Dollar may be starting to wobble below key support itself.
Price resistance remains above last week’s high of 123.74, and a break above that level will turn trader’s attentions to the August and June highs of 125.25 and 125.85 respectively. Given the strength of highly positive correlated markets like UST 2Yr Yield sitting near 5-year high undeniably keeps the bias higher and toward new highs as opposed to breaking below support mentioned above. Traders have the options of looking for the risk: reward favoring trade of buying within a supposed correction and waiting it out with a stop below support of the 100-day moving average or awaiting a breakout of last week’s high to catch the runaway train of USDJPY.
Would You Like To Know How Other Traders Are Positioned in Key Currencies? If so, Click Here