


To receive Ilya's analysis directly via email, please SIGN UP HERE
Talking Points:
- USD/JPY Technical Strategy: Flat
- Support: 118.12, 117.02, 116.09
- Resistance: 119.07, 120.82, 121.84
The US Dollar launched sharply higher against the Japanese Yen, with prices threatening to snap two months of sideways consolidation. A daily close above Triangle pattern resistance at 119.07 exposes the December 23 high at 120.82. Alternatively, a turn below channel top resistance-turned-support at 118.12 clears the way for a challenge of the pattern’s floor at 117.02.
Risk/reward considerations argue against entering long with prices in close proximity to resistance. On the other hand, the absence of a defined bearish reversal signal suggests taking up the long side is premature. We will remain flat for now, waiting for a more actionable opportunity to present itself.
Add these technical levels directly to your charts with our Support/Resistance Wizard app!
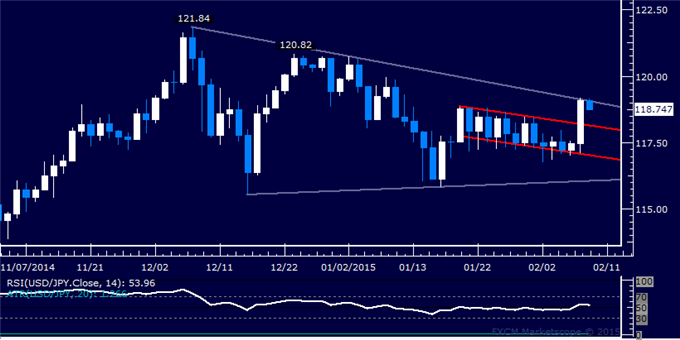
Daily Chart - Created Using FXCM Marketscope
--- Written by Ilya Spivak, Currency Strategist for DailyFX.com


