


USD/CHF Price - Technical Outlook
- Bulls are losing momentum, what’s next?
- Levels and trading zones to keep an eye on
Multi-Week High
On Friday, USD/CHF surged to over four weeks high at 0.9802, then declined after, as some bulls seemed to cut back. Yet, the weekly candlestick closed in the green with a 0.6% gain.
This week, the Relative Strength Index (RSI) remained flat above 50, then pointed lower highlighting a fading bullish momentum.
USD/CHF Daily Price Chart ( JULY 15, 2018 – April 30, 2020) Zoomed Out


USD/CHF Daily Price Chart (DEC 6 – April 30, 2020) Zoomed IN

From the daily chart, I noticed that on April 16 USD/CHF closed above the 50-day moving average, generating a bullish signal. The price rallied after, yet failed twice to climb to the higher trading zone signalling a weaker bullish sentiment. This may cause a fall towards the low end of the current trading zone 0.9640 – 0.9788.
A close below the low end of the aforementioned trading zone opens the door for bears to take charge and possibly press towards 0.9548. A further close below that level could send USDCHF even lower towards 0.9438. Nevertheless, the weekly support levels underlined on the chart (zoomed in) should be monitored.
On the flip-side, any close above the high end of the zone could resume bullish price action towards 0.9921. A further close above that level may extend the rally towards 1.0027. That said, the weekly resistance levels marked on the chart should be watched closely.

USD/CHF Daily Four-Hour Chart (MAR 23 – April 30, 2020)
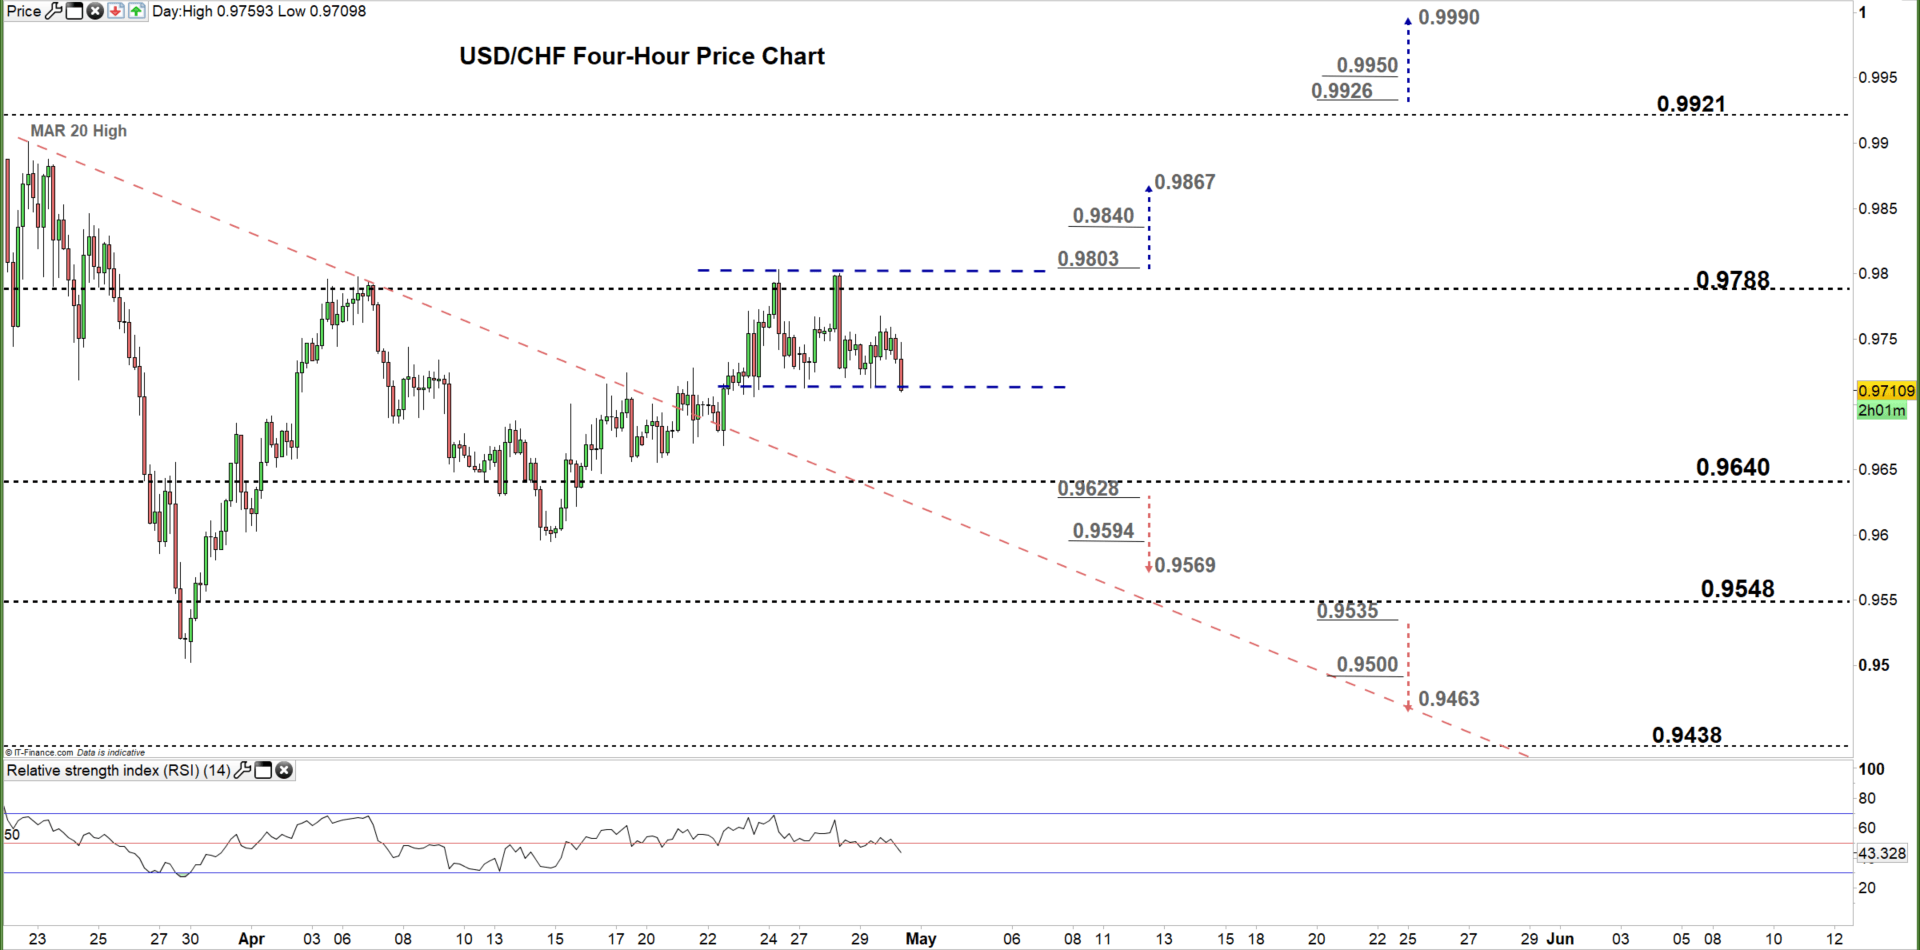
Looking at the four-hour chart, I notice that on April 21 USD/CHF broke above the downtrend line originated from the March 20 high at 0.9901, generating a bullish signal. Later on, the price stuck in a sideways move creating lower highs with higher lows.
A break below 0.9628 could send USDCHF towards 0.9569. Although, the weekly support level underscored on the chart should be kept in focus. In turn, any break in the other direction i.e. above 0.9803 may cause a rally towards 0.9867. That said, the weekly resistance level printed on the chart should be considered.
See the chart to know more about the key technical levels in a further bullish/bearish scenario.

Written By: Mahmoud Alkudsi, Market Analyst
Please feel free to contact me on Twitter: @Malkudsi


