


USD/CHF Price - Technical Outlook
- USD/CHF at its lowest level since 2018
- Breakout levels to know
USD/CHF – Bearish Outlook
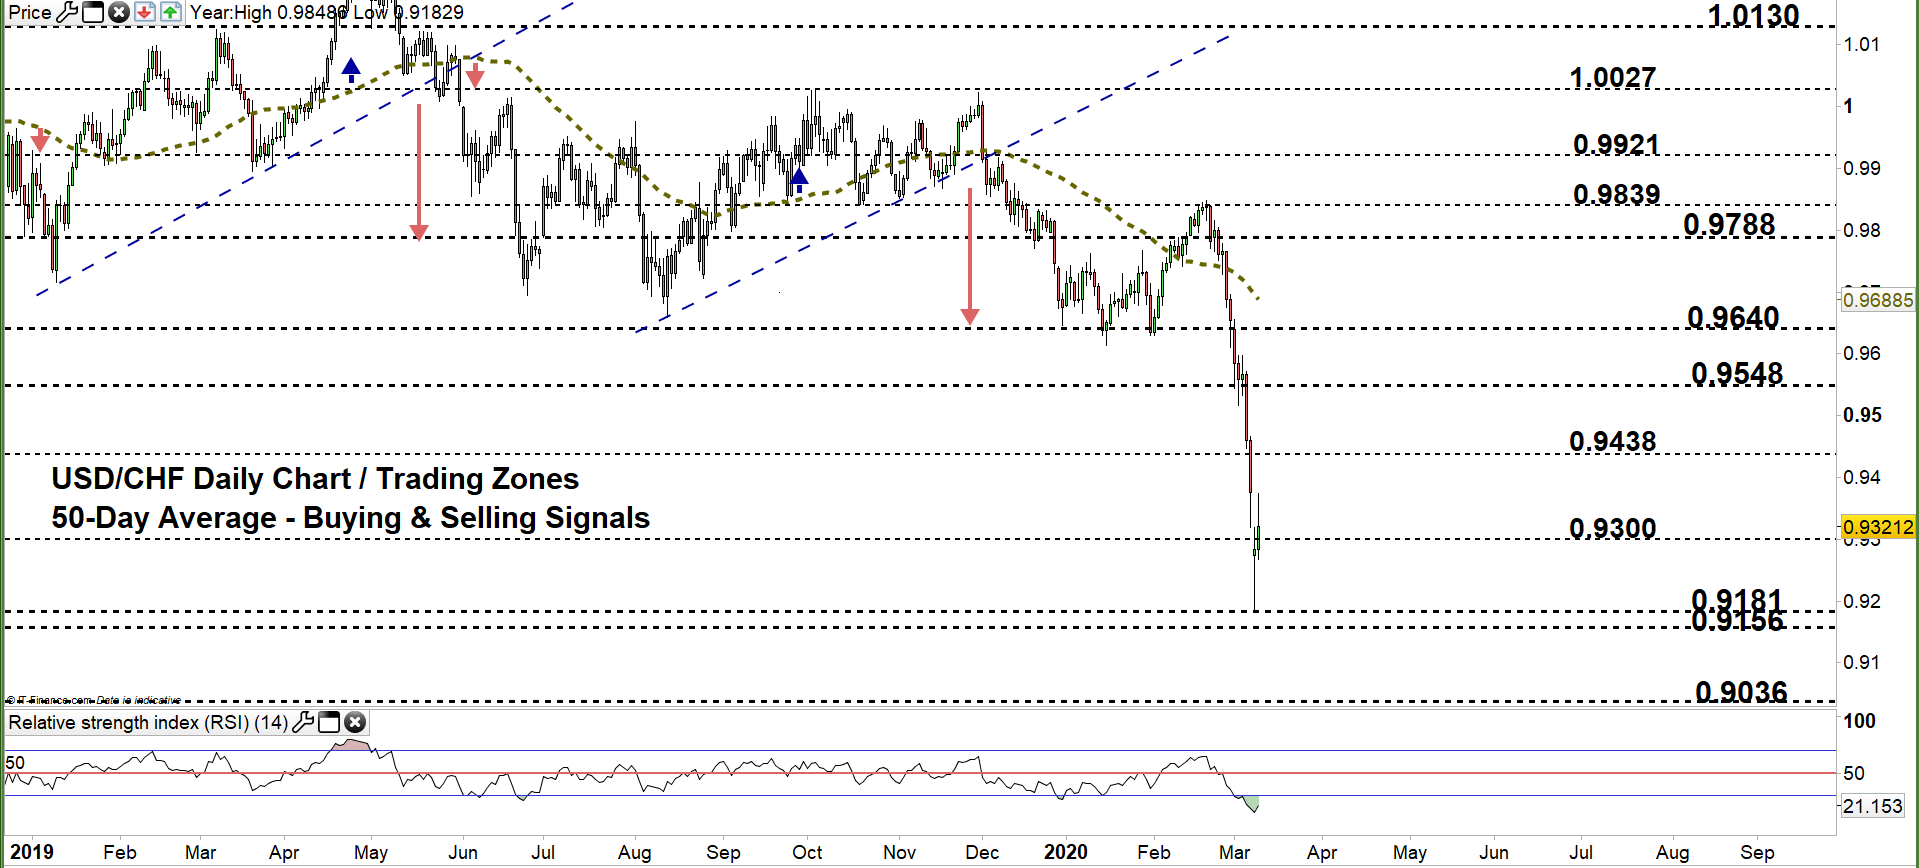
On Friday, USD/CHF tumbled to its lowest level in over two years at 0.9318. The price rallied after as some bears seemed to cover. Yet, the weekly candlestick closed in the red with nearly 2.9% loss.
Alongside that, the Relative Strength Index (RSI) remained in oversold territory emphasizing the strength of downtrend move
USD/CHF Daily Price Chart (MAR 15, 2018 – MAR 10, 2020) Zoomed Out

USD/CHF Daily Price Chart (Aug 13 – MAR 10, 2020) Zoomed IN
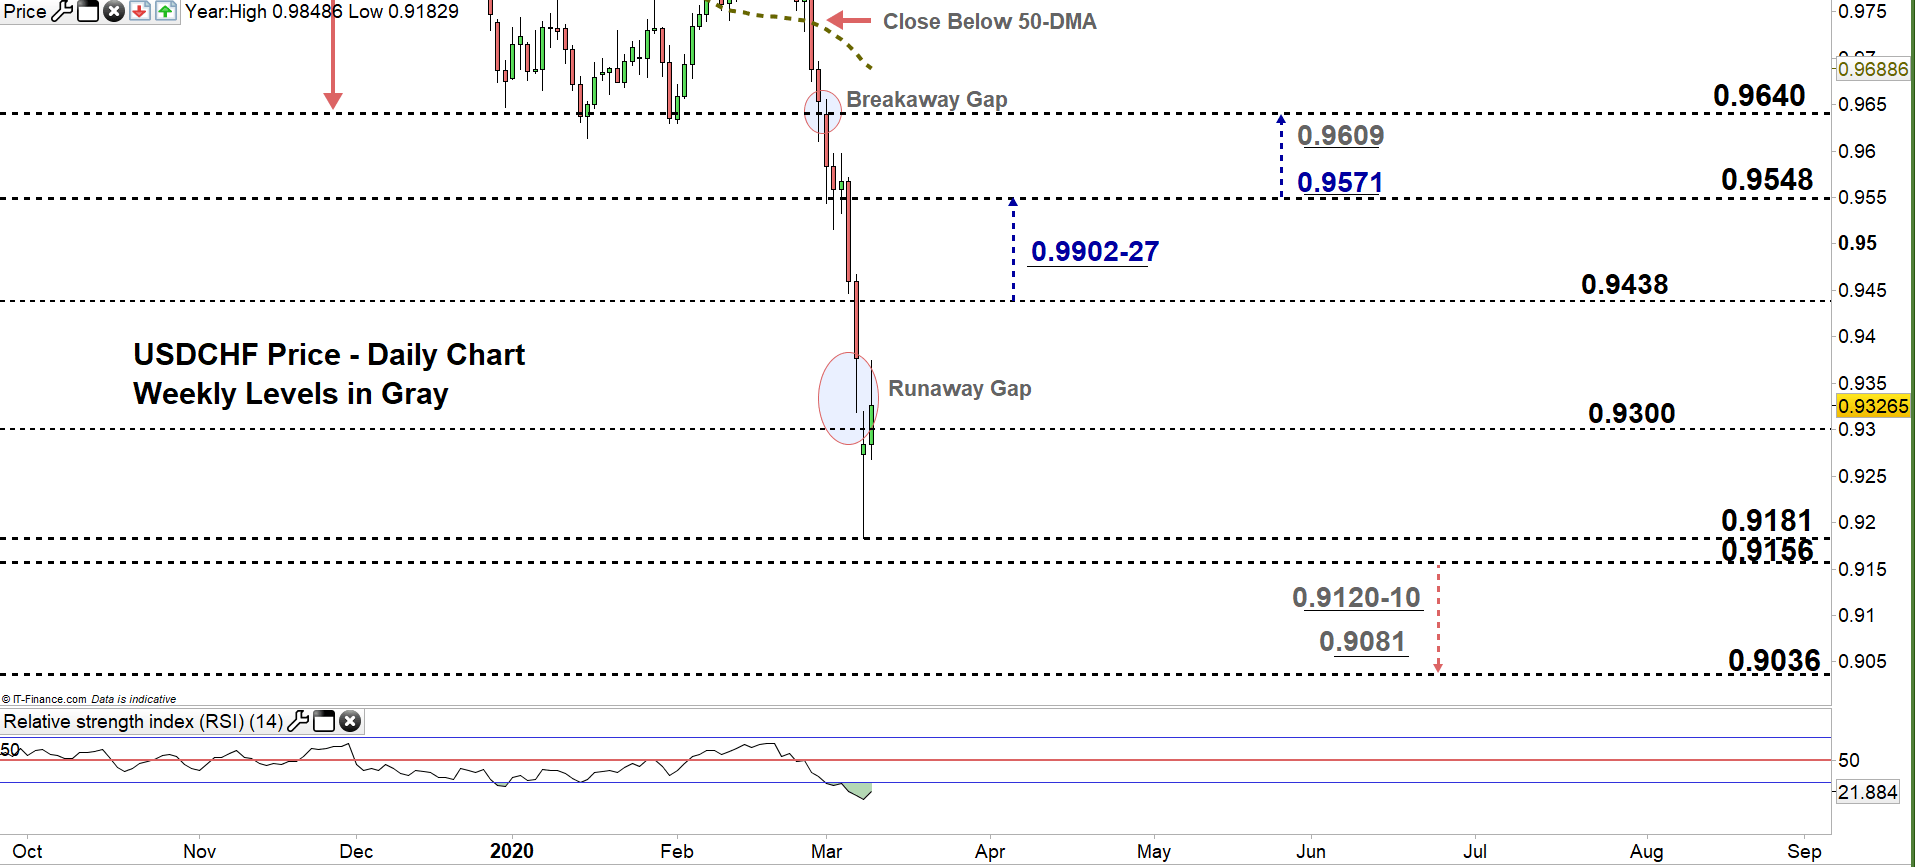
From the daily chart, we noticed that on Feb 27 USD/CHF declined then closed below the 50-day average providing a bearish signal. Last week, the market opened with a gap to the downside (breakaway gap) highlighting the start of a downtrend move. Later on, the price fell to lower trading zones.
This week, the price has opened with another downward gap (runaway gap) indicating that the downtrend move could be far from finished. Yesterday, USDCHF rebounded from the low end of current trading zone 0.9181- 0.9300 then rallied eyeing a test of the high end of it.
A close above the high end may lead more bears to exit the market. This could push the pair towards 0.9438. Further close above this level may cause a rally towards 0.9548. Although, the weekly and daily resistance levels and area marked on the chart (zoomed in) should be considered.
On the other hand, any close below the high end of the zone may embolden bears to press towards the low end of it, then probably attempt to send USDCHF towards its lowest in level in over four and half years. Further close below 0.9156 could mean more bearishness towards 0.9036. That said, the weekly/monthly support levels and area underlined on the chart should be watched closely.

USD/CHF Daily Four-Hour Chart (DEC 9 – MAR 10, 2020)
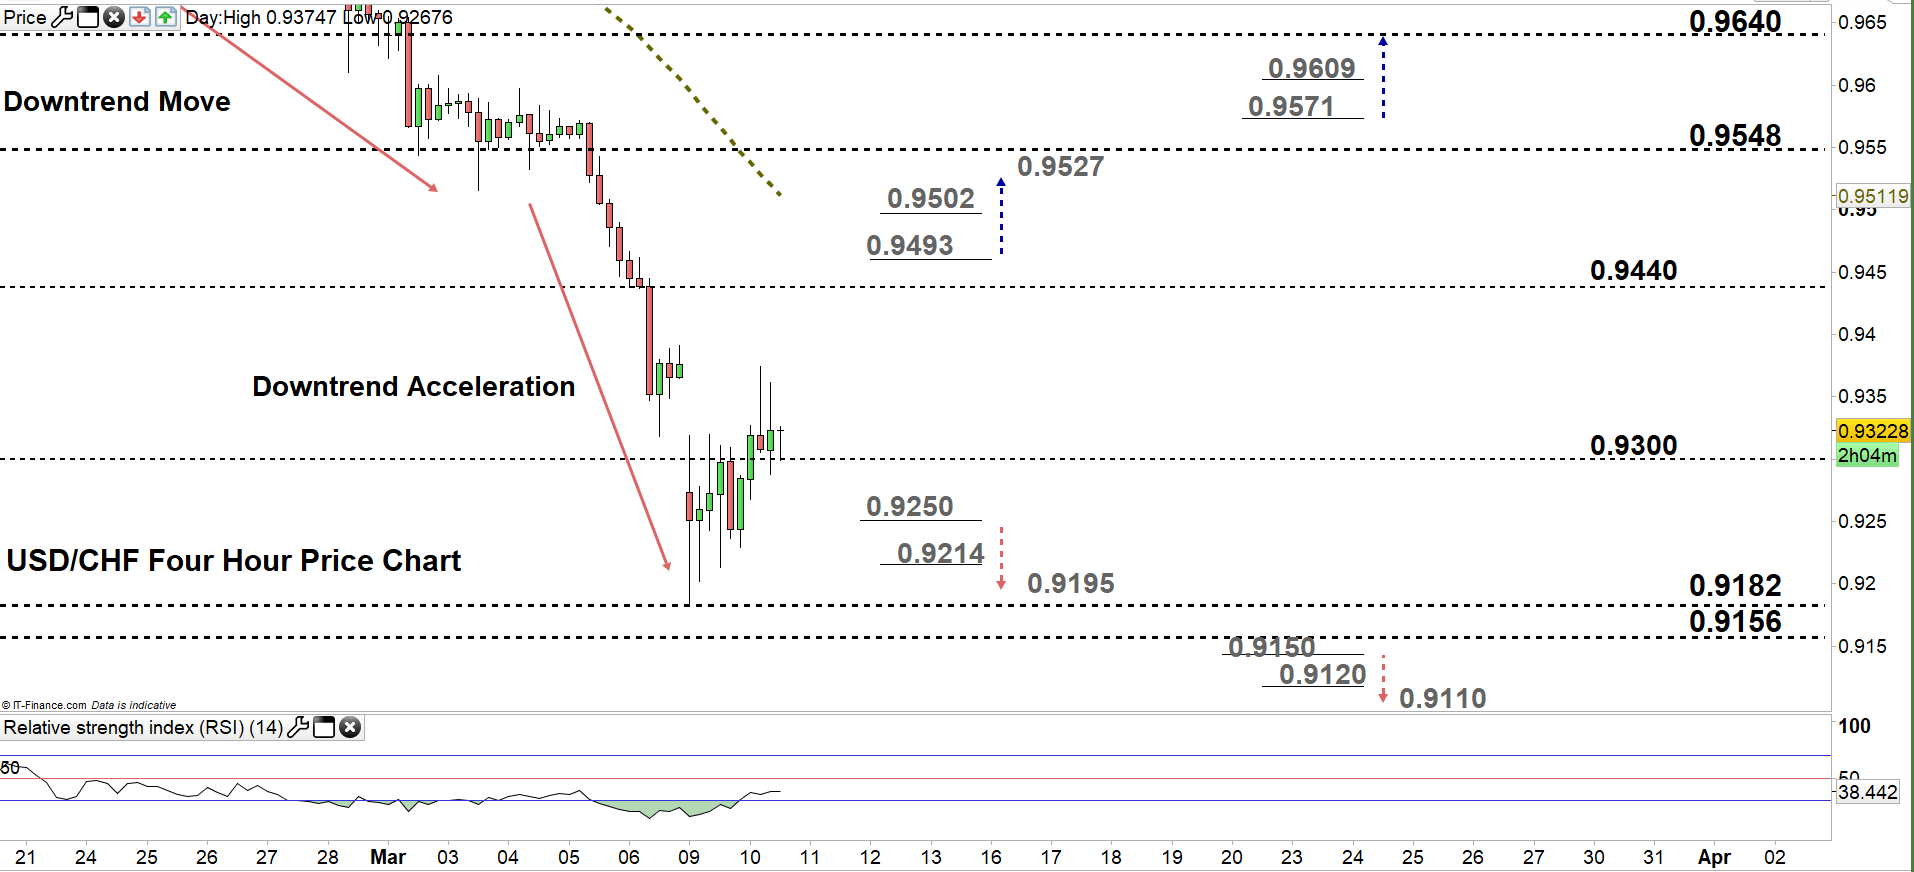
Looking at the four-hour chart, we notice that in late February, USD/CHF started a downtrend move creating lower highs with lower lows. On Thursday, the downtrend move accelerated leading the price to print its lowest since Feb 2018.
Thus, a break below 0.9250 could send USDCHF even lower towards 0.9110. Nevertheless, the daily support level underscored on the chart should be considered. In turn, a break above 0.9493 may cause a rally towards 0.9527. Although, the daily resistance level printed on the chart would be worth monitoring.
See the chart to know more about the key technical levels in a further bullish/bearish scenario.

Written By: Mahmoud Alkudsi
Please feel free to contact me on Twitter: @Malkudsi


