


USD/CHF Technical Forecast
- US Dollar against Swiss Franc charts and analysis

USD/CHF – Multi Month Low
Last week, USD/CHF broke below the monthly support at 0.9659 then rebounded form 0.9646- its lowest level in fifteen months. However, the pair rallied after as some sellers took profit. On Friday, the price closed the weekly candlestick with a 0.2% loss.
Alongside this, the Relative Strength Index (RSI) abandoned oversold territory and pointed higher towards 42 highlighting weaker downtrend momentum.
Just getting started? See our Beginners’ Guide for FX traders
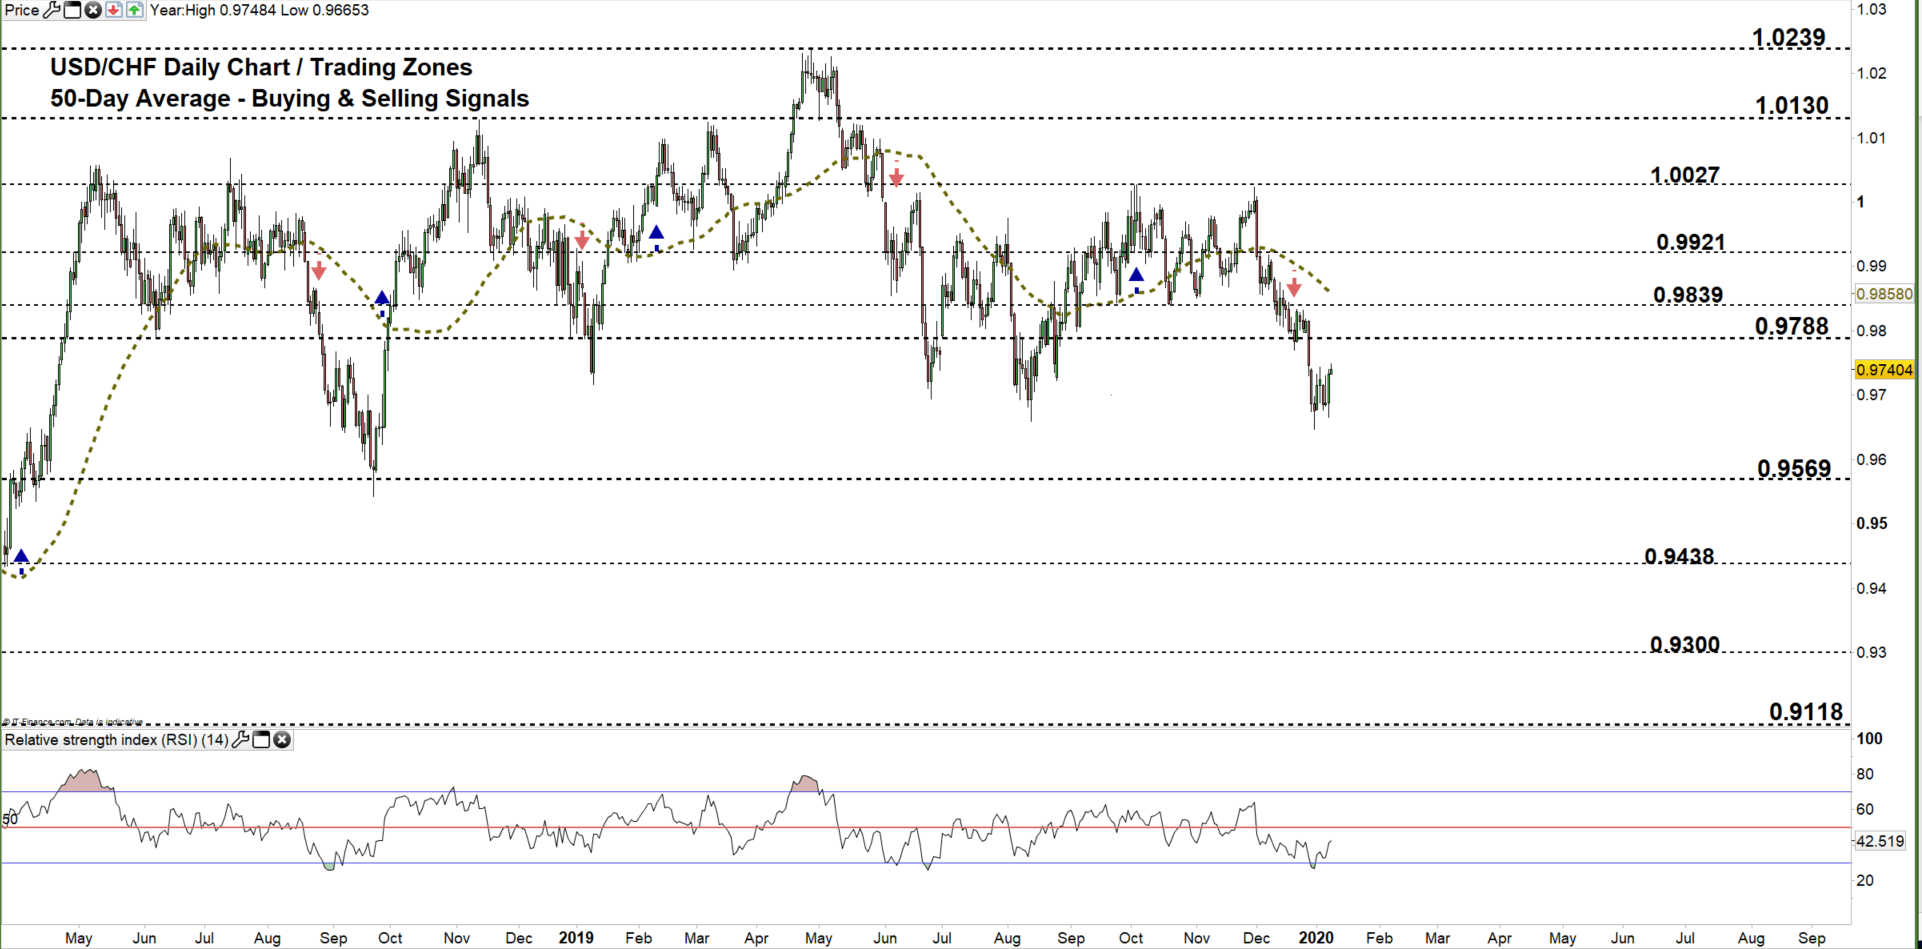
USD/CHF Daily Price Chart (April 1, 2017 – JAN 9, 2020) Zoomed Out
USD/CHF Daily Price Chart (Aug 15 – JAN 9, 2020) Zoomed IN
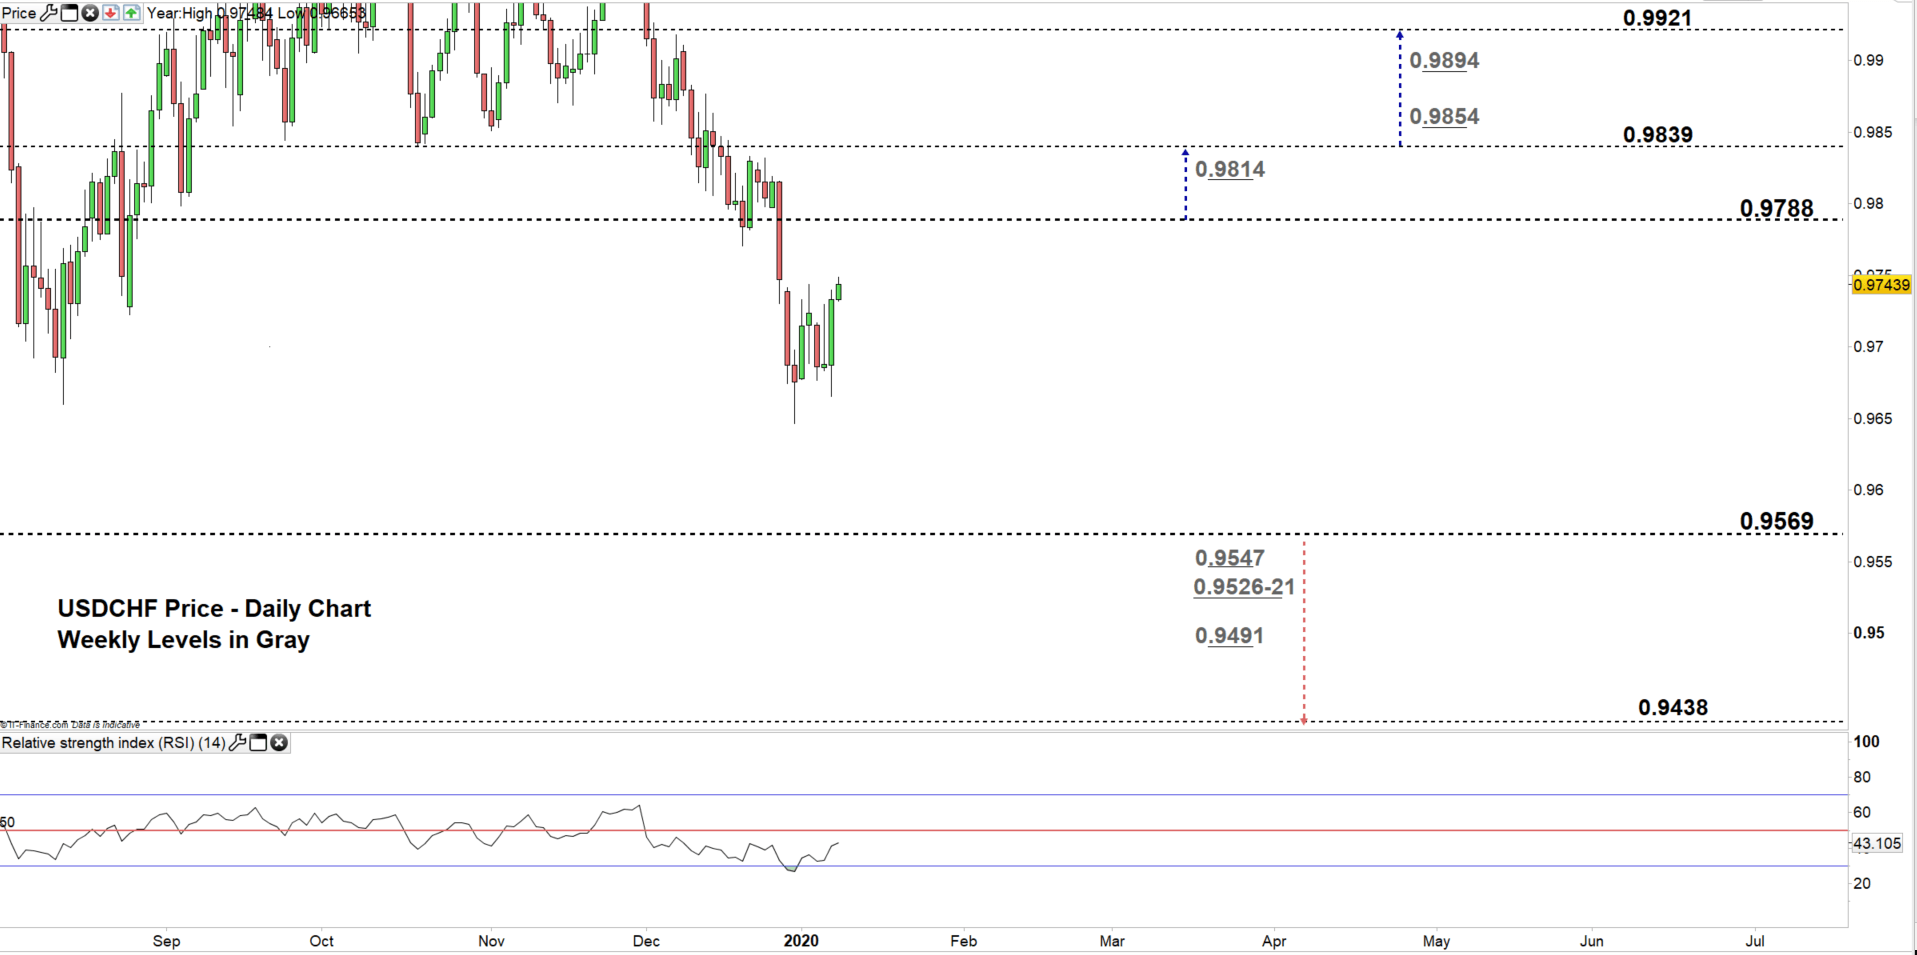
From the daily chart, we notice on Dec 27 USD/CHF declined to a lower trading zone 0.9569 – 0.9788. Thus, the price could be on its way for a test of the low end of the zone.
A close below the low end could encourage sellers to press towards 0.9438. In that scenario, a special attention should be paid to the weekly support levels and area marked on the chart (zoomed in) as some market participants could exit at these points.
On the flip side, a close above the high end of the zone signals seller’s hesitation. This could push the price towards 0.9839. Further close above this level opens the way for buyers to lead the USDCHF towards 0.9921. That said, the weekly resistance levels underscored on the chart should be monitored.

USD/CHF Daily Four-Hour Chart (DEC 5 – JAN 9, 2020)

Looking at the four-hour chart, we notice today USD/CHF tests the neckline of double bottom pattern located at 0.9743. Additionally, the price could test today the downtrend line originated from the Dec 6 high at 0.9918.
Thus, a break above 0.9798 may cause a rally towards 0.9839. Although, the weekly resistance level underlined on the chart should be kept in focus. On the other hand, a break below 0.9685 could send USDCHF towards 0.9646. Yet, the daily support level should be watched closely.
Having trouble with your trading strategy? Here’s the #1 Mistake That Traders Make
Written By: Mahmoud Alkudsi
Please feel free to contact me on Twitter: @Malkudsi


