


EUR/CHF & USD/CHF Technical Analysis
- Euro and US Dollar against Swiss Franc charts and analysis
Did you check our latest forecasts on USD and EUR and Gold? Find out more for free from our Q4 forecasts for commodities and main currencies
USD/CHF, EUR/CHF - Price Action
On Friday, USD/CHF rallied to 1.0023 – its highest level in over eight weeks. The price closed the weekly candlestick with a 0.2% gain. Similarly, EUR/CHF printed three weeks high at 1.1023 then closed the week’s session with 0.2% gain.
The Relative Strength Index (RSI) remained flat above 50 on both pairs, highlighting weak buyers in a bullish market.
Just getting started? See our Beginners’ Guide for FX traders
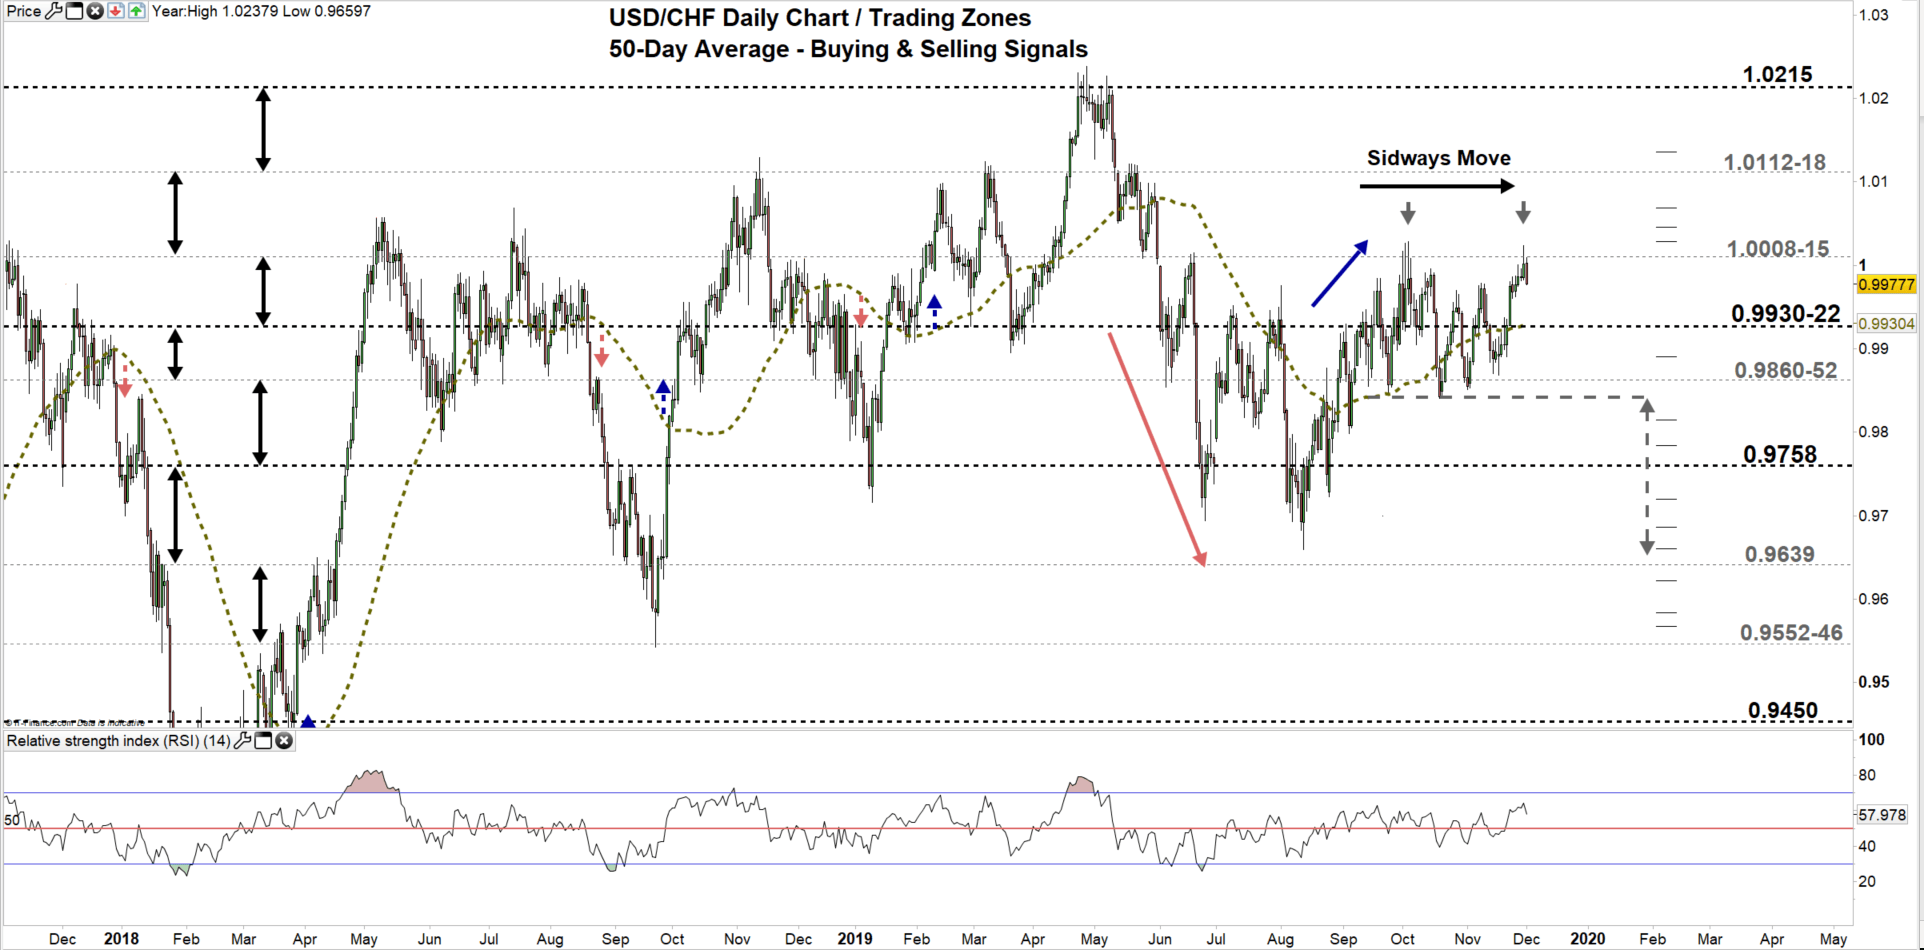
USD/CHF Daily Price Chart (NOV 8, 2017 – DEC 2, 2019) Zoomed Out
USD/CHF Daily Price Chart (July 1– DEC 2, 2019) Zoomed IN
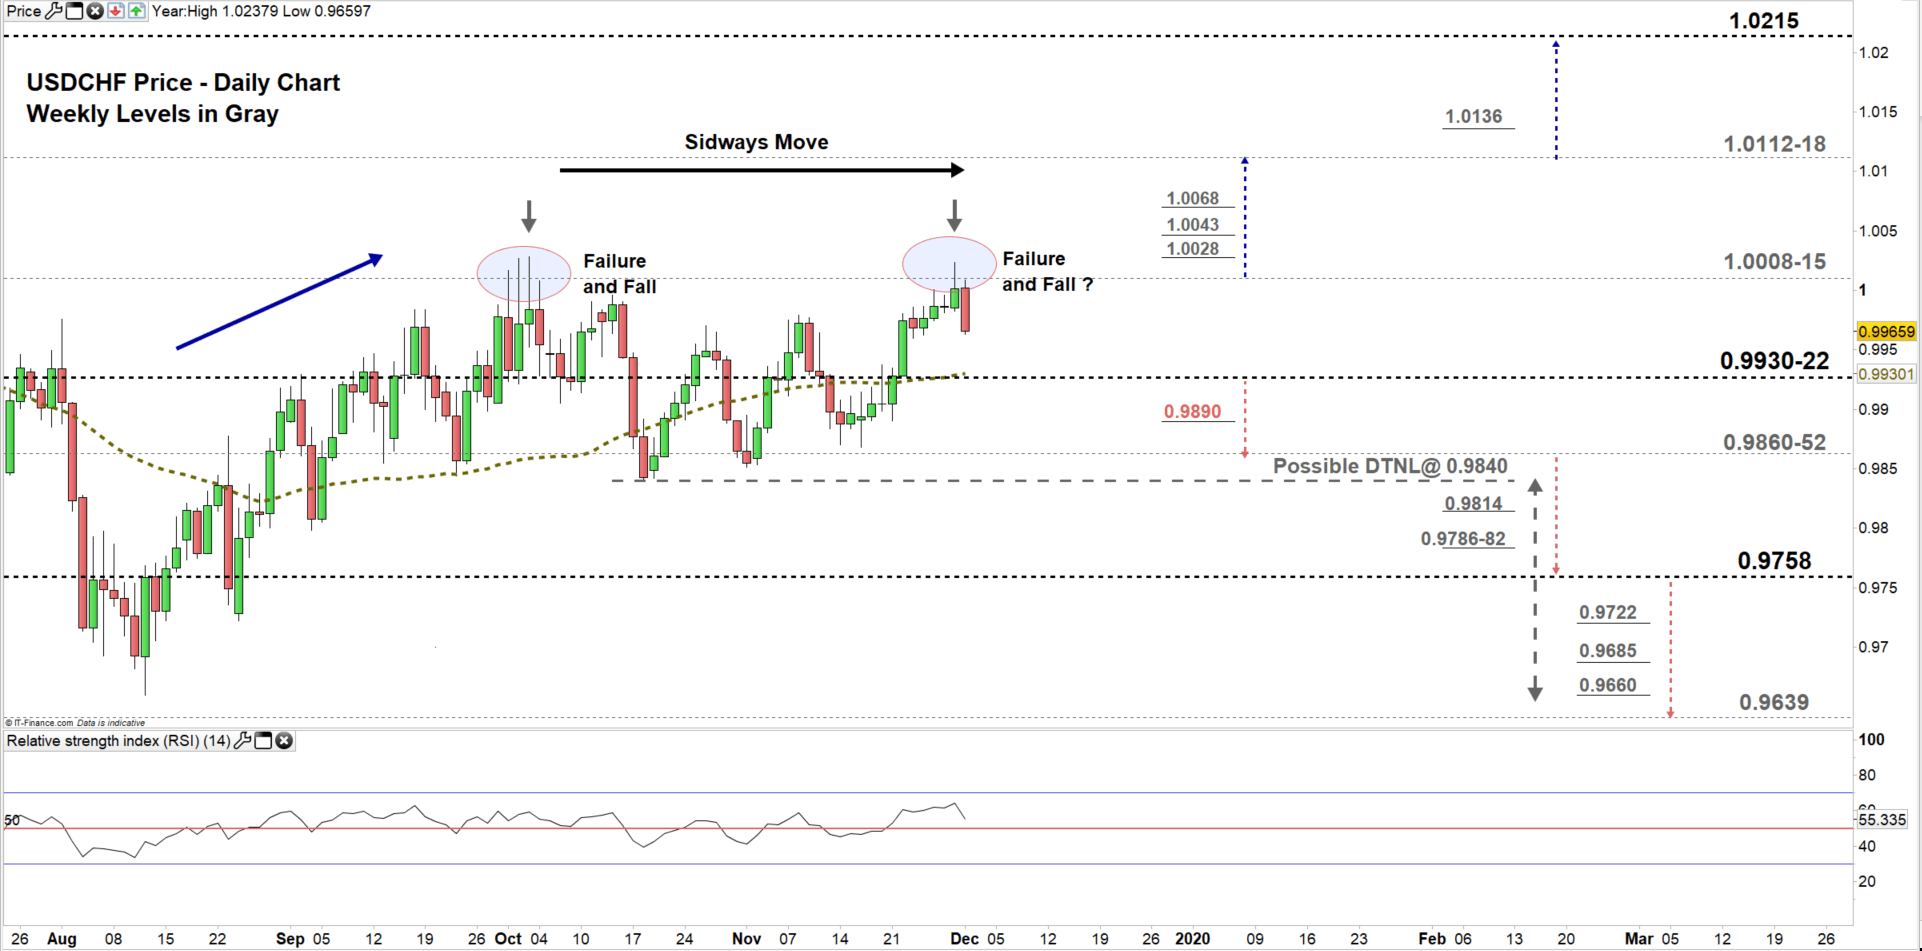
Looking at daily chart, we notice on early Oct USD/CHF printed its highest level in five months at 1.0028, then failed to rally further. Later, the price declined as buyers exited the market.
On Friday, similar scenario happened. Therefore, the price could be on its way for a test of the low end of current trading zone 0.9930 – 1.0008. Further close below 0.9922 could lead more buyers to abandon the market and would open the door for sellers to take charge and press towards the vicinity of 0.9660-52. Although, the weekly daily support level underlined on the chart should be monitored.
That said, any failure in closing below the low end of the zone could reverse the price’s direction, sending USD/CHF towards the high end. Further close above 1.0015 could lead more buyers to enter the market and push towards the vicinity of 1.0112-18. Yet, the weekly resistance levels marked on the chart should be kept in focus.
Having trouble with your trading strategy? Here’s the #1 Mistake That Traders Make
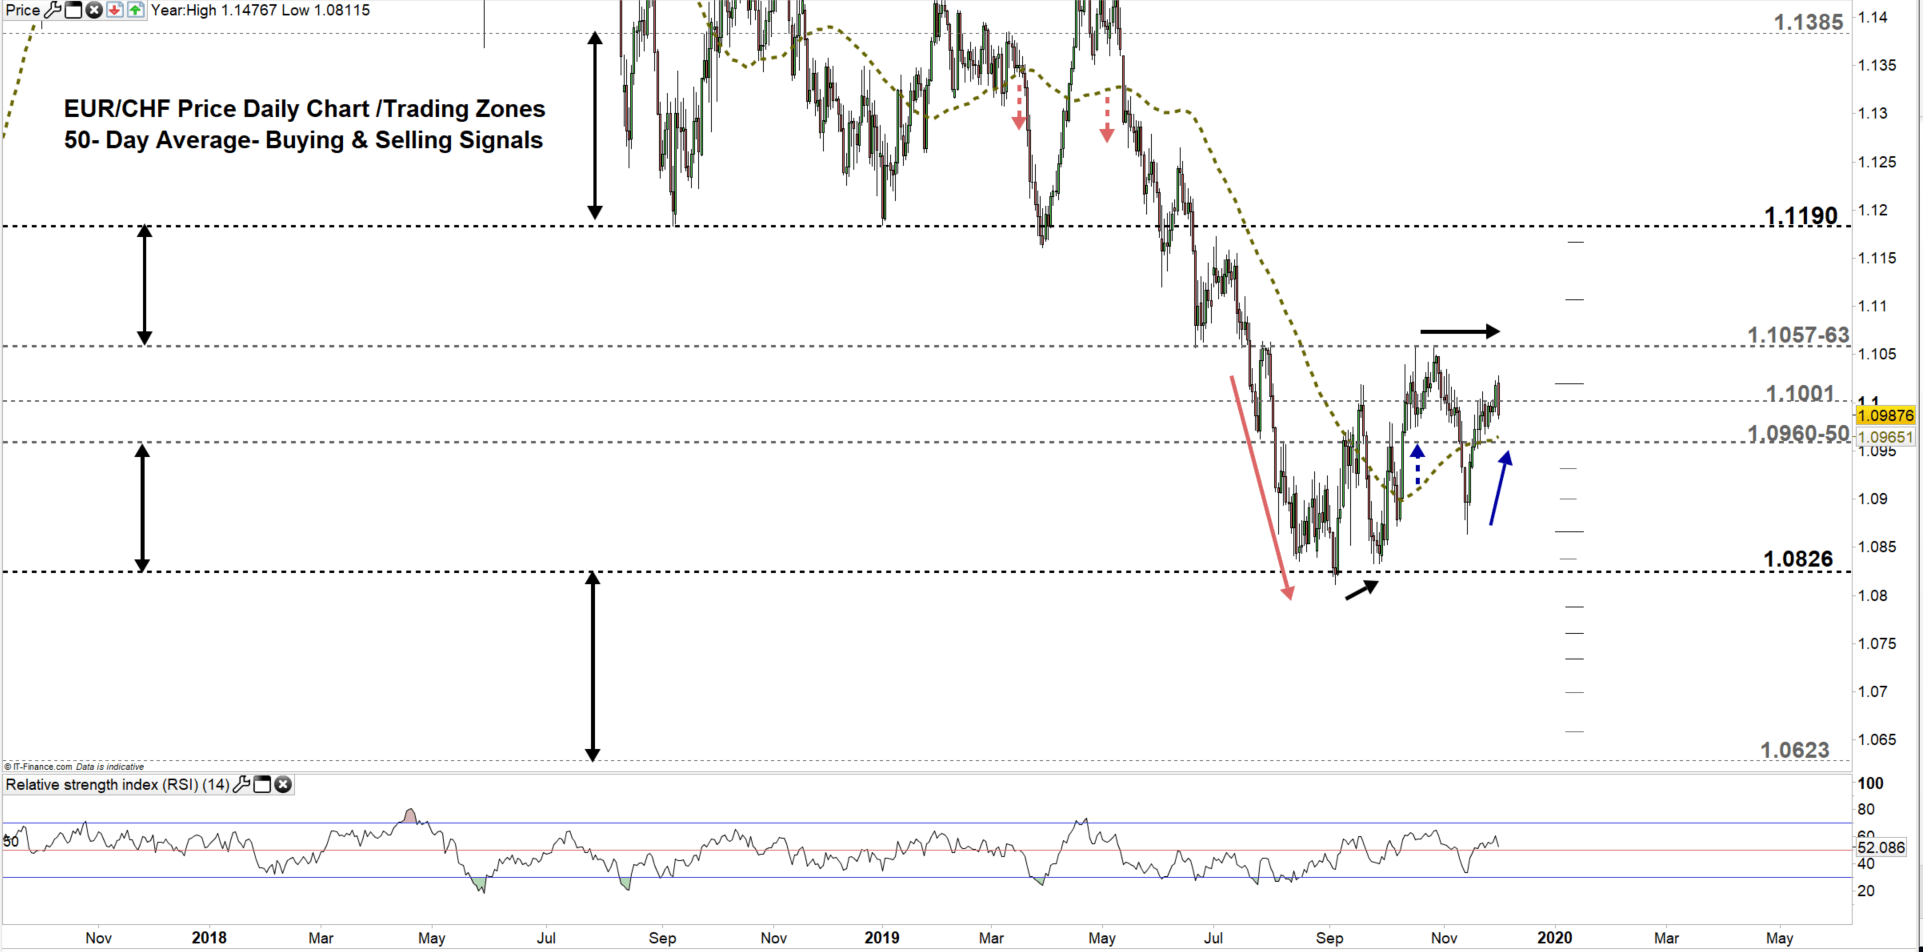
EUR/CHF Daily Price Chart (Oct 10, 2017 – DEC 2, 2019) Zoomed Out
EUR/CHF Daily Price Chart (July 1 – DCE 2, 2019) Zoomed IN

From the daily chart, we notice on Nov 19 EUR/CHF rallied then closed above the 50-day average, since then the price has been moving ineffectively. On Friday, the moved to a higher trading zone 1.1001- 1.1057 hinting to rally to a multi- month high.
Hence, a close above 1.1063 could send the pair towards 1.1190. Although, bullish momentum could weaken at the marked areas marked on the chart (zoomed in) as some buyers could take profit at these points.
That said, A close below 1.0950 would mean buyer’s hesitation and could send EURCHF towards 1.0826. Further close below this level may convince more sellers to join the market and press towards 1.0623. In that scenario, the daily and weekly support levels underscored on the chart should be considered.
Join Me on Friday, DEC 6 at 14:00 GMT. In this session we will talk about most common directional and momentum indicators and how to use them
Written By: Mahmoud Alkudsi
Please feel free to contact me on Twitter: @Malkudsi


