


EUR/CHF and USD/CHF Charts and analysis
- Swiss Franc price action against Euro and US Dollar
Did you check our latest forecasts on USD and EUR and Gold? Find out more for free from our Q3 forecasts for commodities and main currencies
USD/CHF, EUR/CHF – Stalling Uptrend Move
On Sep 4, EUR/CHF reversed course after printing its lowest level in 28 months. The pair rallied as disscussed in our last update, then on Friday closed in the green with 0.1% gain. Additionaly, USD/CHF U-turned and carved out a higher low at 0.9798 indicating that buyers still in charge.
Last week, the Relative Strength Index (RSI) climbed above 50 on both pairs reflecting buyer’s intention to send the price higher. Although, the oscillator remained flat this week around 57 pausing the uptrend momentum.
Just getting started? See our Beginners’ Guide for FX traders
USD/CHF Daily Price Chart (AUG 28, 2017 – SEP 11, 2019) Zoomed Out

USD/CHF Daily Price Chart (April 15 – SEP 11, 2019) Zoomed IN
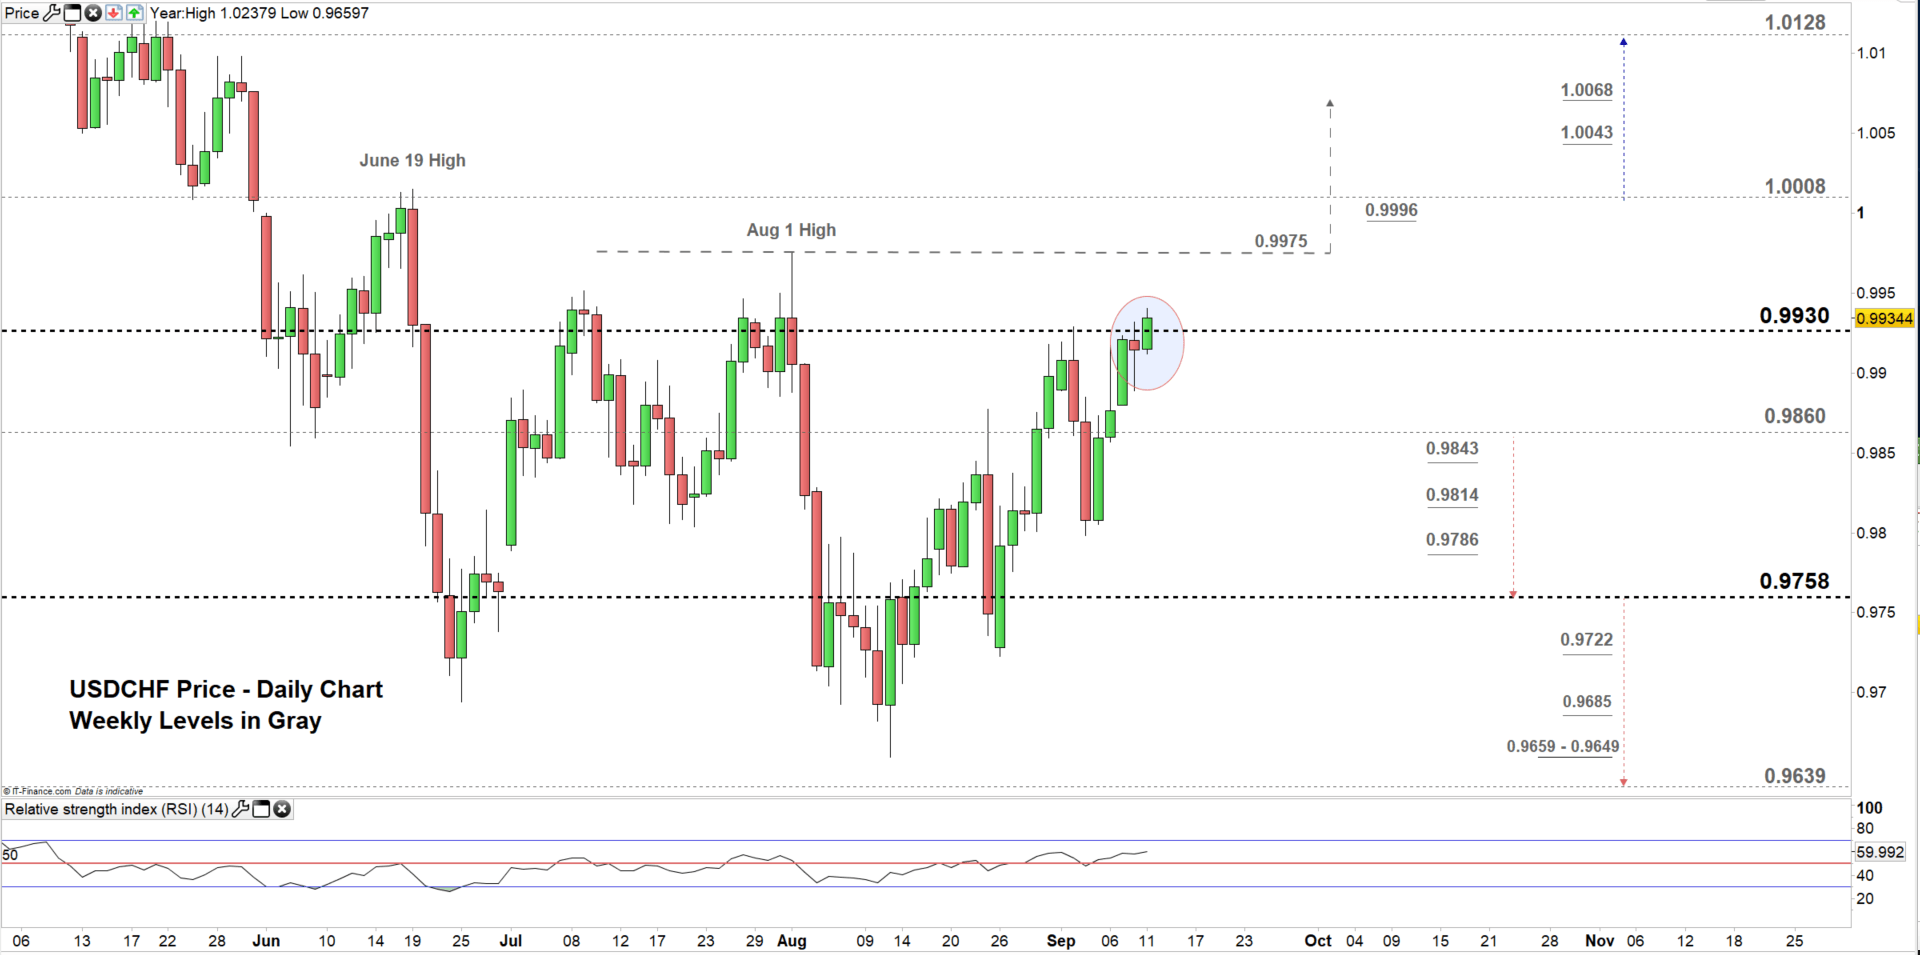
Looking at daily chart, we notice on Friday USD/CHF moved to a higher trading zone 0.9860 – 0.9930. This week buyer attempted to rally the price to a higher zone although failed so far.
Thus, any successful close above the high end of the zone could push USD/CHF towards 1.0008. That said, buyers would need to keep an eye on the Aug 1 high with the weekly resistance level marked on the chart (zoomed in). Further close above 1.0008 could see the price trading even higher towards 1.0128. However, the weekly resistance levels underlined on the chart should be kept in focus.
On the flip side, another failure to close above the high end of the zone could change the pair’s direction and send it towards the low end. Further close below the low end might press USD/CHF towards 0.9758. Nonetheless, the weekly support levels underscored on the chart should be considered.
Having trouble with your trading strategy? Here’s the #1 Mistake That Traders Make
EUR/CHF Daily Price Chart (FEB 10, 2017 – SEP 11, 2019) Zoomed Out

EUR/CHF Daily Price Chart (JUN 5 – SEP 11, 2019) Zoomed IN
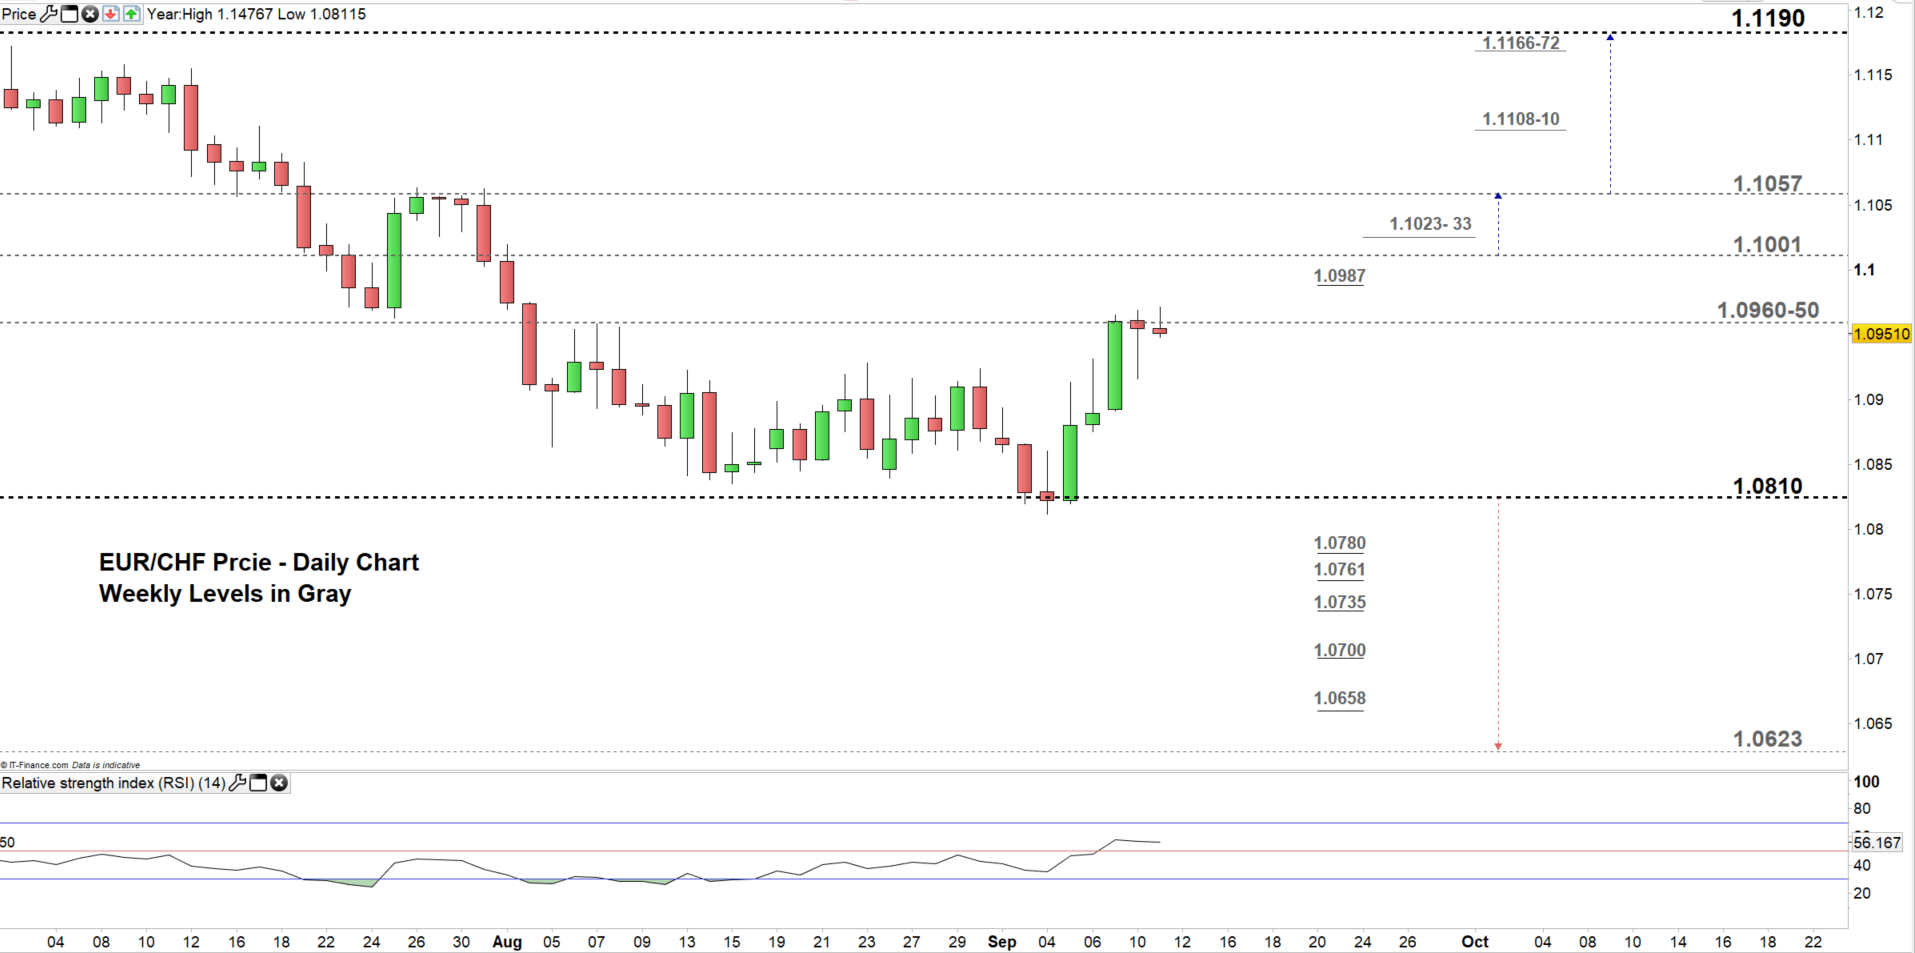
Looking at the daily chart, we notice at the start of the week EUR/CHF moved to a higher trading zone 1.0950 – 1.1001 however, slipped back after. Today, the price tries hardly to resume bullish price action.
Hence, any close below the low end could reverse the pair’s course sending it towards 1.0810. Further close below this level may continue bearish price action towards 1.0623. In that scenario, the weekly support levels underlined on the chart (zoomed in) need to be watched closely.
On the other hand, if EUR/CHF closes today above 1.0960 this could see the price pushing towards the high end of the zone. Although, the weekly resistance levels marked on the chart would be worth monitoring.
Written By: Mahmoud Alkudsi
Please feel free to contact me on Twitter: @Malkudsi


