


EUR/CHF and USD/CHF Outlook
- Euro and US Dollar price against Swiss Franc Charts and Analysis
Did you check our latest forecasts on USD and EUR and Gold? Find out more for free from our Q3 forecasts for commodities and main currencies
USD/CHF, EUR/CHF – Stronger US Dollar Across the Board
Since mid-August, EUR/CHF has been trading ineffectively without any clear direction. On Friday, the pair closed in the green - first time in four weeks with mere 0.1% gain. On the other hand, USD/CHF traded higher and closed the weekly candlestick with 1.5% gain.
Alongside this, the Relative Strength Index (RSI) pointed lower on EUR/CHF and dropped from 45 to 37 highlighting the current downtrend is still intact. In turn, (RSI) crossed above 50 and climbed to 59 starting a fresh uptrend momentum on USD/CHF.
Just getting started? See our Beginners’ Guide for FX traders
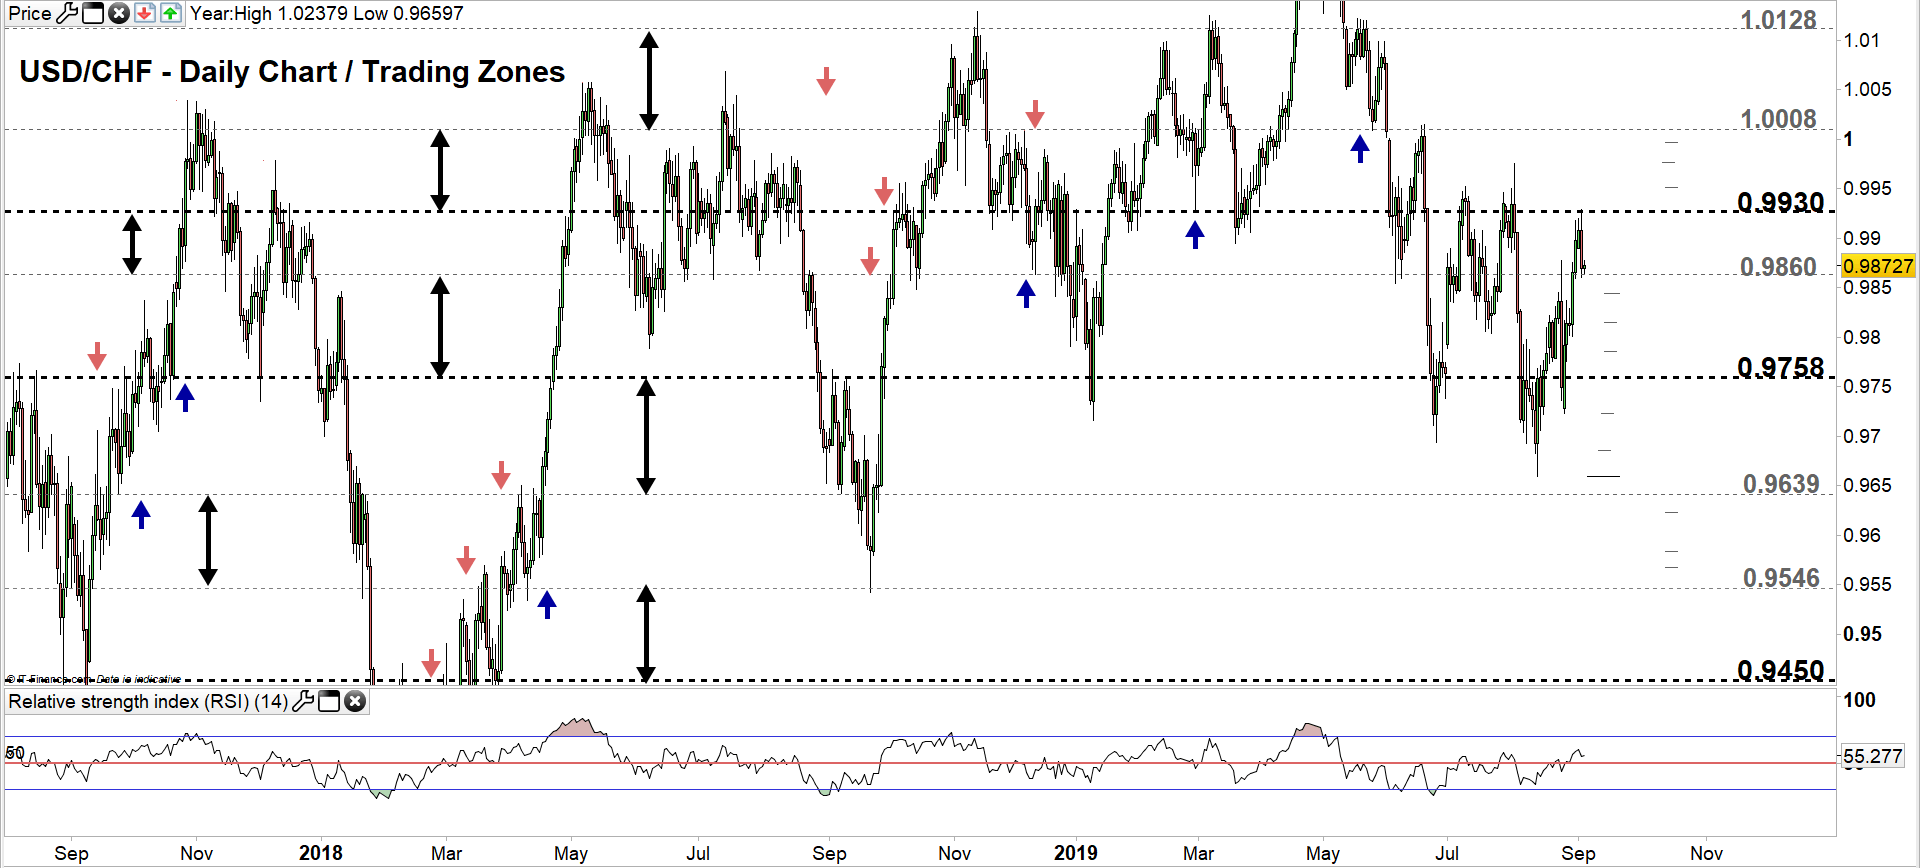
USD/CHF Daily Price Chart (JULY 28, 2017 – SEP 4, 2019) Zoomed Out
USD/CHF Daily Price Chart (April 15 – SEP 4, 2019) Zoomed IN
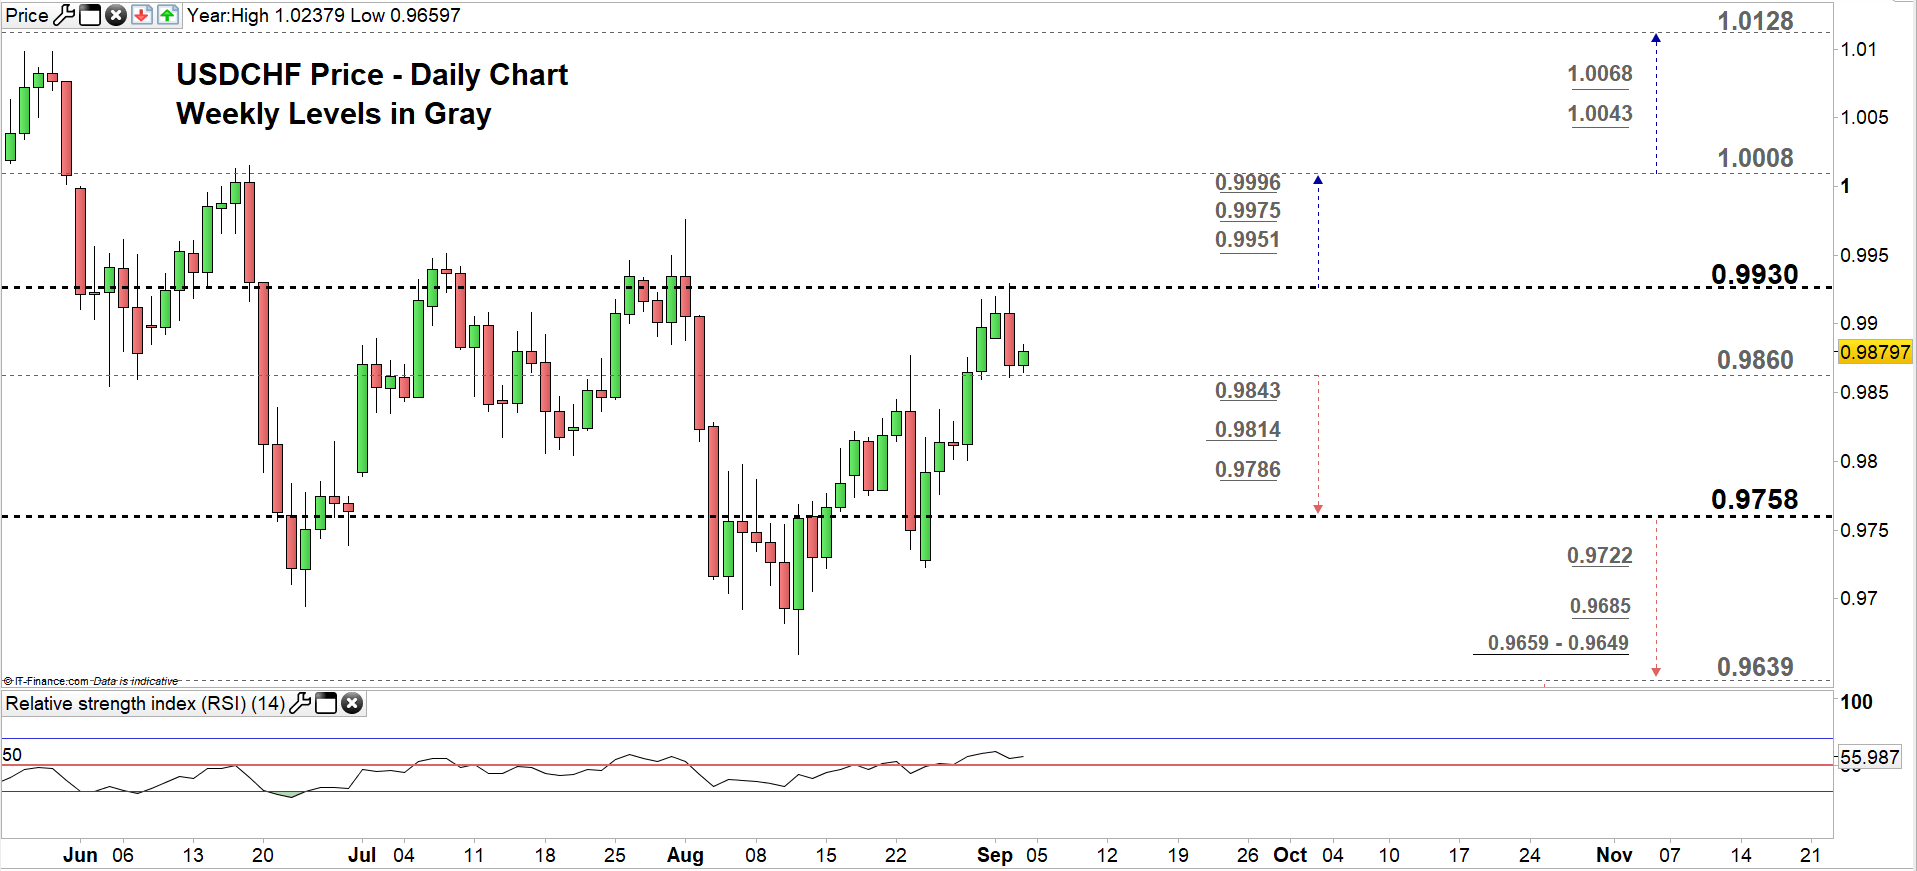
From the daily chart, we notice that on Friday USD/CHF rallied to a higher trading zone 0.9860 – 0.9930. Yesterday, the price tested both ends however, continued trading in the zone.
Hence, a close below the low end of the zone could press USD/CHF towards 0.9758. Although the weekly support levels marked on the chart need to be watched closely. See the chart to know more about the lower trading zone with the weekly support levels that should be monitored in a further bearish move.
On the other hand, a close above the high end of the zone may send the price towards 1.0008. In that scenario, buyers need to consider the weekly resistance levels underlined on the chart. See the chart to find out more about the higher trading zone with the weekly resistance levels USD/CHF could encounter in a further bullish move.
Having trouble with your trading strategy? Here’s the #1 Mistake That Traders Make
EUR/CHF Daily Price Chart (FEB 10, 2017 – SEP 4, 2019) Zoomed Out

EUR/CHF Daily Price Chart (JUN 15 – SEP 4, 2019) Zoomed IN

Looking at the daily chart, we notice on August 7 EUR/CHF rebounded from the high end of current trading zone 1.0810 – 1.0960 then stuck in a sideways move.
Thus, any close below the low end could resume bearish price action towards 1.0623. That said, sellers need to pay a close attention on the weekly support levels underlined on the chart (zoomed in).
It’s also worth noting that since August 13 EUR/CHF has been moving in a rectangle pattern. Yesterday, the price broke below the lower line at 1.0840 eyeing a test of 1.0761.
On the flip-side, if EUR/CHF rallies above the higher line of the rectangle at 1.0929 the price may continue for a test of the high end of the current trading zone, and if closes above this could push the price towards 1.1001. Nonetheless, the weekly resistance levels underscored on the chart should be considered.
Written By: Mahmoud Alkudsi
Please feel free to contact me on Twitter: @Malkudsi


