


Euro and US Dollar Outlook
Did you check our latest forecasts on USD and EUR and Gold? Find out more for free from our Q3 forecasts for commodities and main currencies
USD/CHF, EUR/CHF – Sellers in Charge
Last week EUR/CHF continued it downside move testing its lowest levels in 26 months at 1.0835. On Friday the pair closed in the red for the third week in a row losing 0.4% of its value.
Similarly, USD/CHF tested its lowest levels in 11 months at 0.9659 however, before the end of the week US Dollar reversed its direction against Swiss Franc, then closed the weekly candlestick in the green with nearly 0.6% profit.
Alongside this, the Relative Strength Index (RSI) climbed above the oversold territory on EURCHF however, remained flat around 34, reflecting the seller’s domination. On the other hand, the oscillator failed to cross above 50 on USDCHF highlighting the buyer’s lack of momentum to start uptrend move.
Just getting started? See our Beginners’ Guide for FX traders
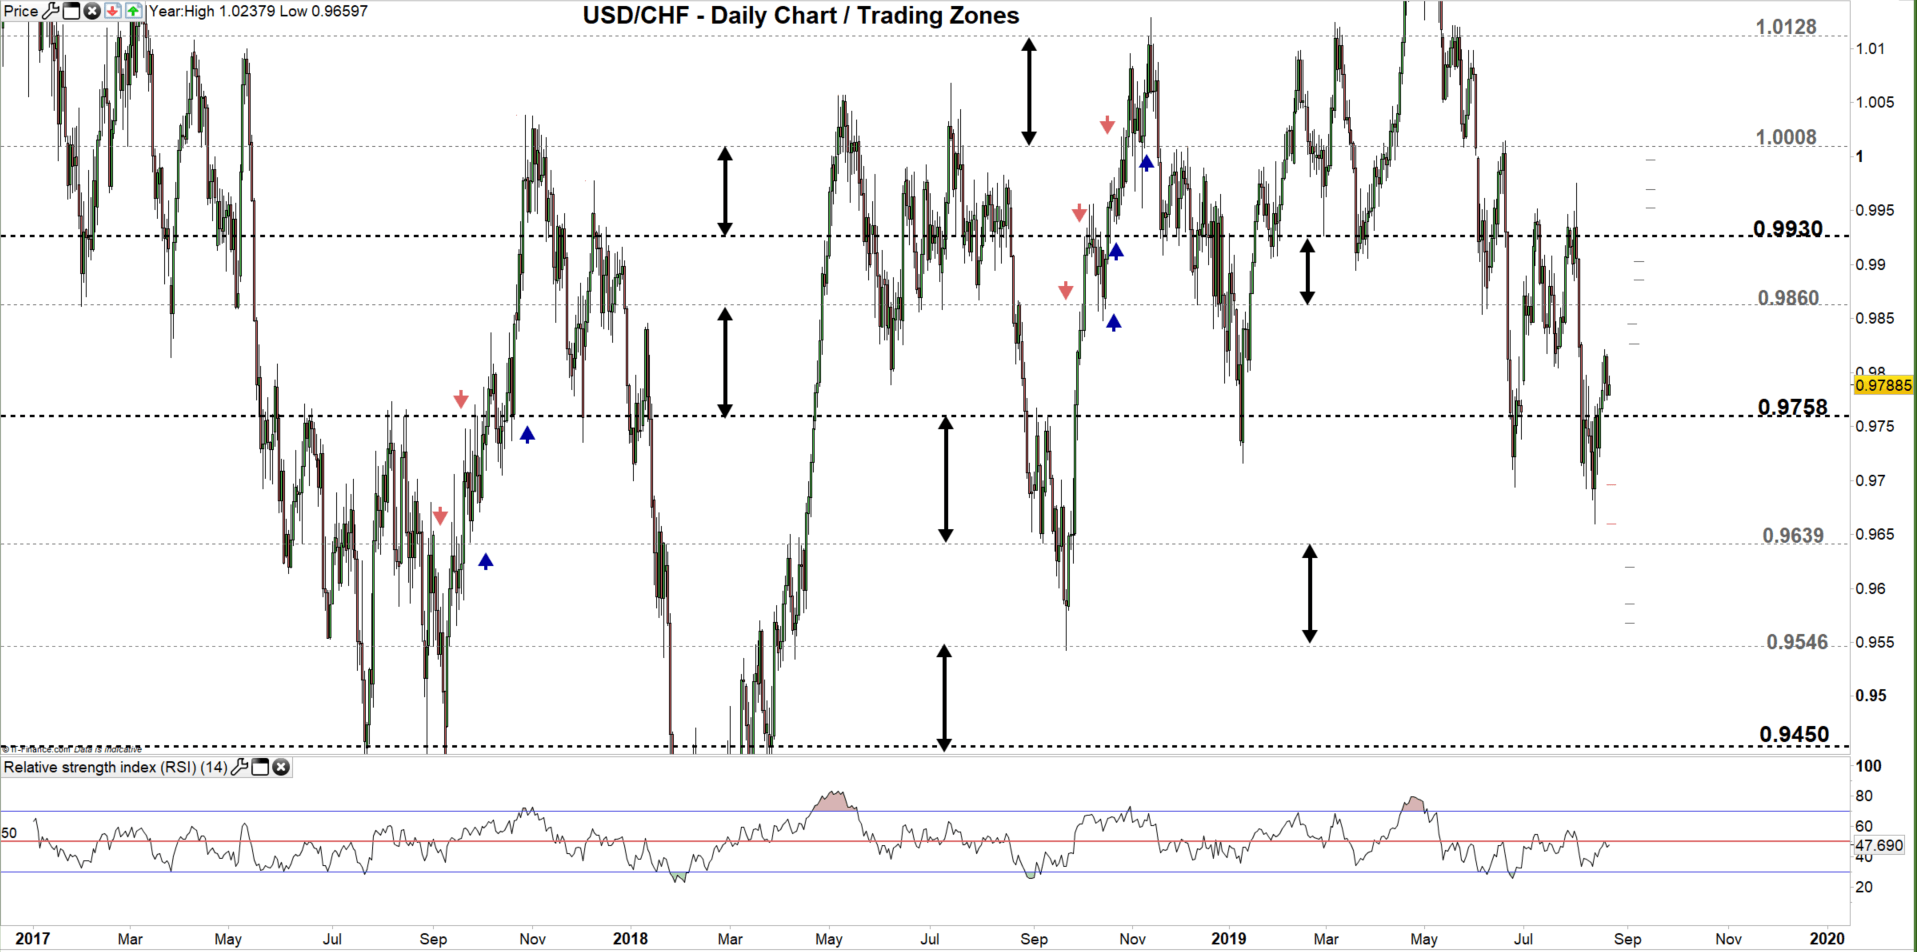
USD/CHF Daily Price Chart (JAN 1, 2017 – AUG 21, 2019) Zoomed Out
USD/CHF Daily Price Chart (May 14 – AUG 21, 2019) Zoomed IN

Looking at daily chart, we notice on Thursday USD/CHF closed successfully above 0.9758 after failing previously in five attempts.
Currently, the pair is moving in a higher trading zone 0.9758 – 0.9860 looking for a test of the high-end contingent on clearing the daily resistance levels underlined on the chart (zoomed in).
A close above the high end could send USDCHF towards 0.9930 however, the weekly resistance levels underlined on the chart should be considered. See the chart to know more about the higher trading zone with the weekly resistance levels buyers would encounter in a further bullish move.
In turn, a close below the low end of the zone could press USDCHF towards 0.9639. Nonetheless, the weekly support levels and area marked on the chart would be worth monitoring.
Having trouble with your trading strategy? Here’s the #1 Mistake That Traders Make
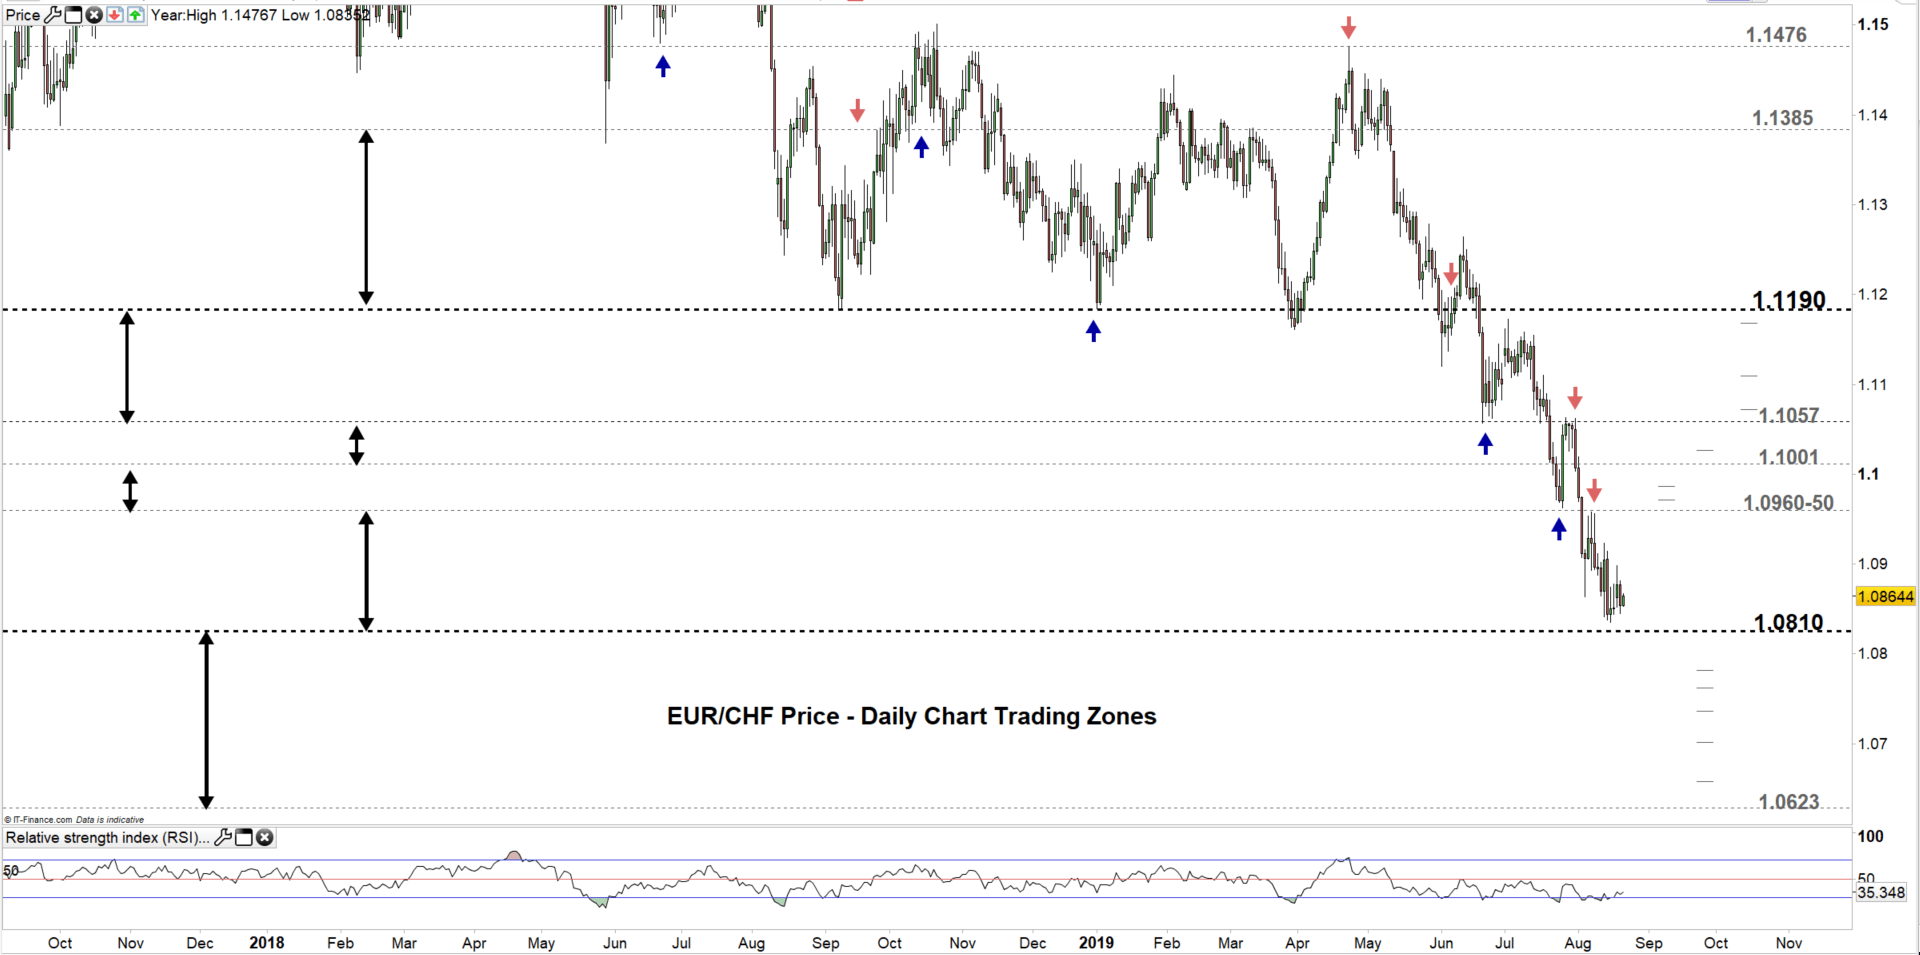
EUR/CHF Daily Price Chart (SEP 10, 2017 – AUG 21, 2019) Zoomed Out
EUR/CHF Daily Price Chart (MAY 1 – AUG 21, 2019) Zoomed IN

Looking at the daily chart, we notice since August 7 EUR/CHF has been pointing to the downside, eyeing a test of the low end of current trading zone 1.0810 – 1.0960.
Thus, a close below the low end of the zone could send the price towards 1.0623. Although, the weekly support levels underlined on the chart (Zoomed in) need to be followed closely.
On the flip-side, any failure to close below the low end of the zone could push EURCHF towards the high end. The daily resistance level at 1.0923 should be considered. Further close above the high end may see the price trading even higher towards 1.1001. Nonetheless, the resistance levels underscored on the chart need to be kept in focus.
Written By: Mahmoud Alkudsi
Please feel free to contact me on Twitter: @Malkudsi


