


Swiss Franc Price Outlook
- USD/CHF and EUR/CHF charts and analysis
- US Dollar and Euro price action against Swiss Franc.
Download for free our latest Forecasts to learn how USD, Gold and other main currencies may move in Q3.
EUR/CHF, USD/CHF – Closing in the Red
Last week Euro and US dollar declined against Swiss Franc after failing at a key resistance. EURCHF closed the weekly candlestick with 1.3% loss. Similarly, USDCHF closed with 1.1% loss, emphasizing the risk off status in the markets at this stage.
Alongside this, the Relative Strength Index (RSI) remained below 50 on USD/CHF for over two months indicating to buyer’s lack of momentum to start uptrend move. Similar story with EUR/CHF with the oscillator remained below 50 for near three months reflecting the sellers domination.
Just getting started? See our Beginners’ Guide for FX traders
USD/CHF Daily Price Chart (FEB 10, 2018 – AUG 7, 2019) Zoomed Out

USD/CHF Daily Price Chart (May 1 – AUG 7, 2019) Zoomed IN
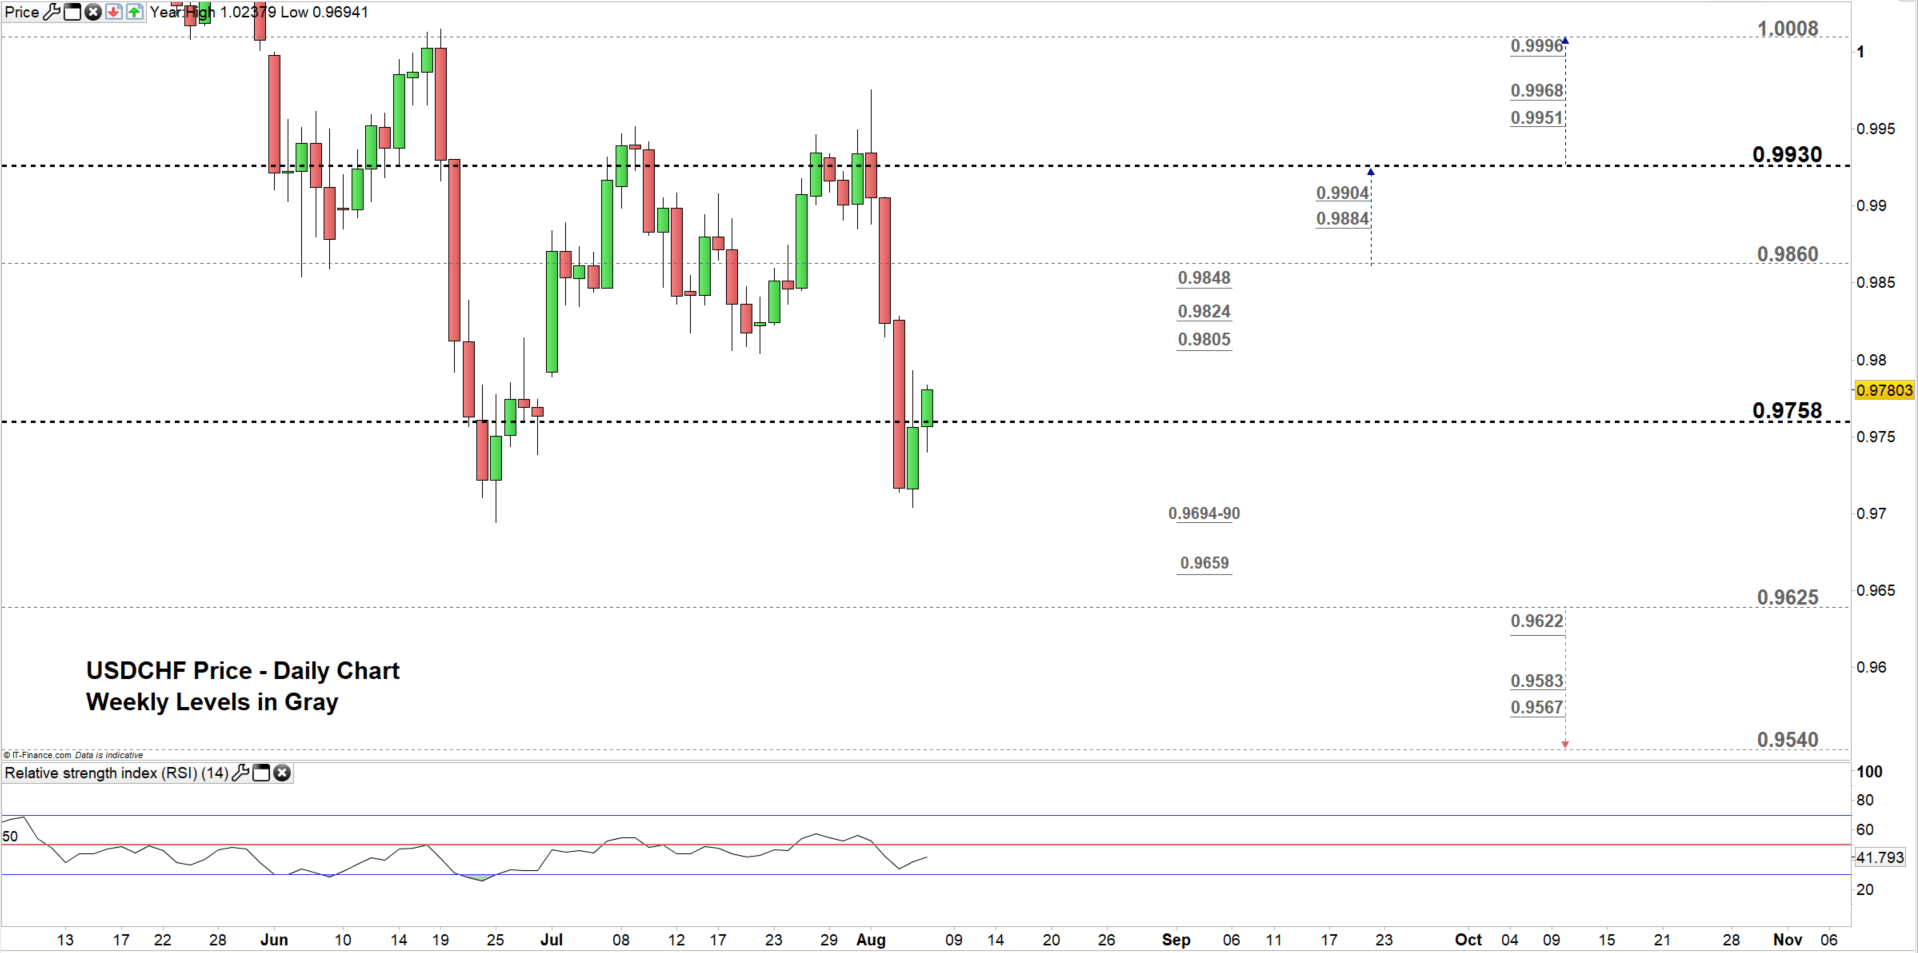
Looking at daily chart, we notice yesterday USD/CHF fell to 0.9703 -its lowest level in near seven weeks, then the price rallied for a test of the higher trading zone 0.9758 – 0.9860.
Hence, a close above the low end of this zone could push the price to the high end. Although, the weekly resistance levels underlined on the chart (zoomed in) should be watched along the way. See the chart to find out more about the higher trading zone and the weekly resistance levels to watch in a further bullish scenario.
On the flip side, any failure in closing above the low end of the zone may be considered as a sign of weakness and could send the price towards 0.9625. Nonetheless, the weekly support vicinity and level marked on the chart would be worth monitoring.
Having trouble with your trading strategy? Here’s the #1 Mistake That Traders Make
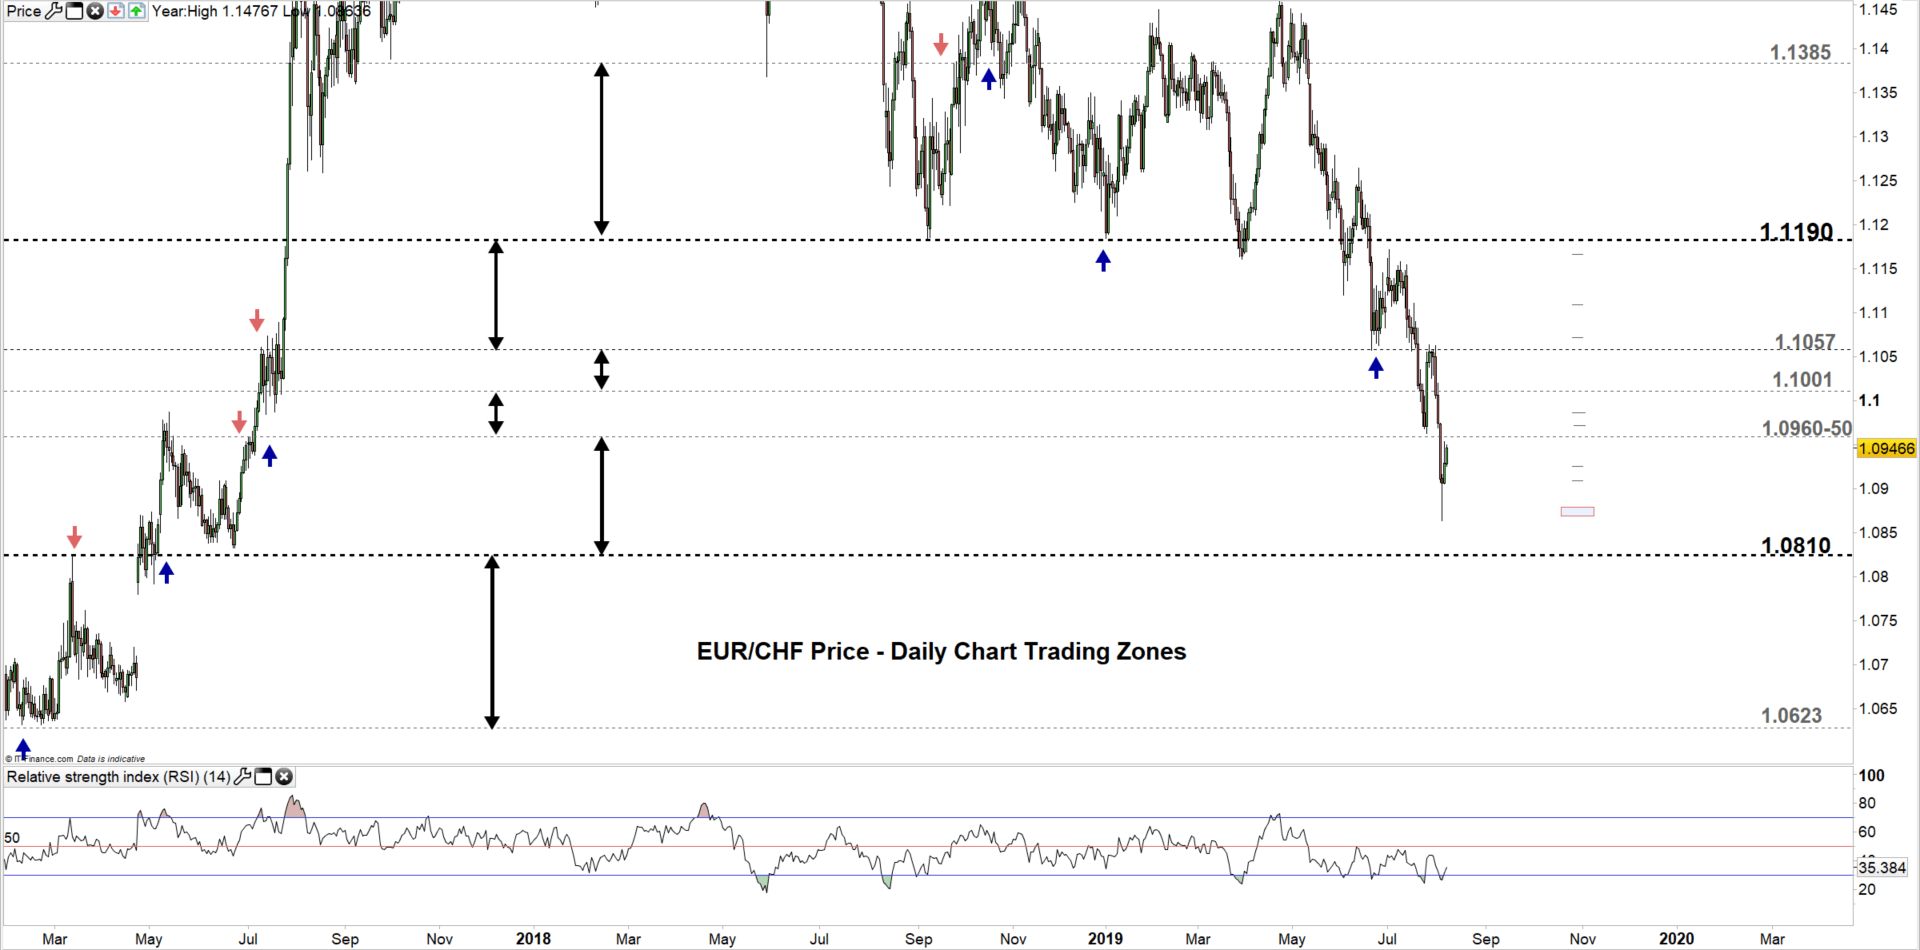
EUR/CHF Daily Price Chart (FEB 15, 2018 – AUG 7, 2019) Zoomed Out
EUR/CHF Daily Price Chart (MAY 15 – AUG 7, 2019) Zoomed IN
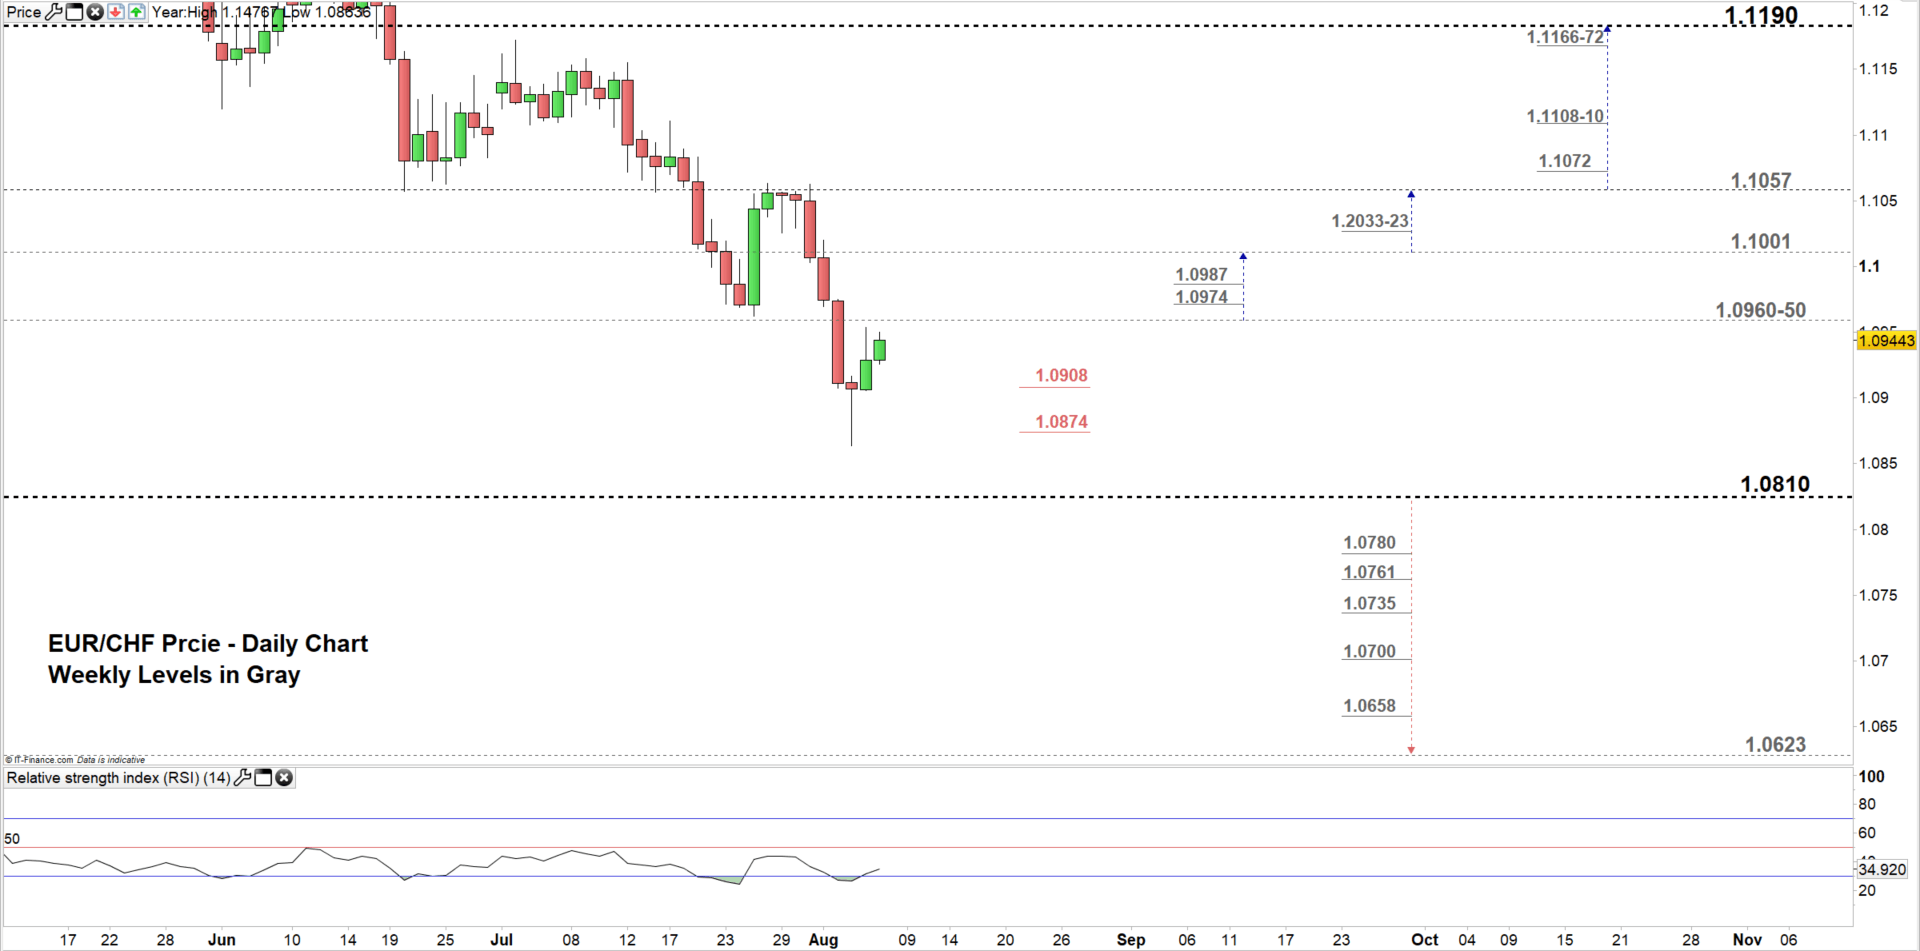
Looking at the daily chart, we notice on Monday EUR/CHF tumbled to 1.0863- its lowest level in near 25 months. However, the price reversed direction before testing the low end of current trading zone 1.0810 – 1.0960 and pushed higher for a test of the high end.
Thus, a close above the high end could cause a rally towards 1.1001. Although, the weekly resistance levels underlined on the chart (zoomed in) need to be watched closely. Further close above this level may send the price towards 1.1057. The weekly resistance area marked on the chart should be kept in focus.
On the other hand, any failure to close above the high end of current trading zone could send the price towards the low end. Nonetheless, the daily support levels underscored on the chart should be considered. See the chart to know more about the lower trading zone and the weekly support levels to monitor in a further bearish scenario.
Written By: Mahmoud Alkudsi
Please feel free to contact me on Twitter: @Malkudsi


