


USD/CHF Technical Analysis
See the Q2 USD and CHF forecast to learn what is likely to drive price action through mid-year.
Check the DailyFX Economic Calenda r for a comprehensive look at all latest data releases.
Having trouble with your trading strategy? Here’s the #1 mistake that traders make
USD/CHF Daily Price Chart (Oct 2018 –May 13, 2019)
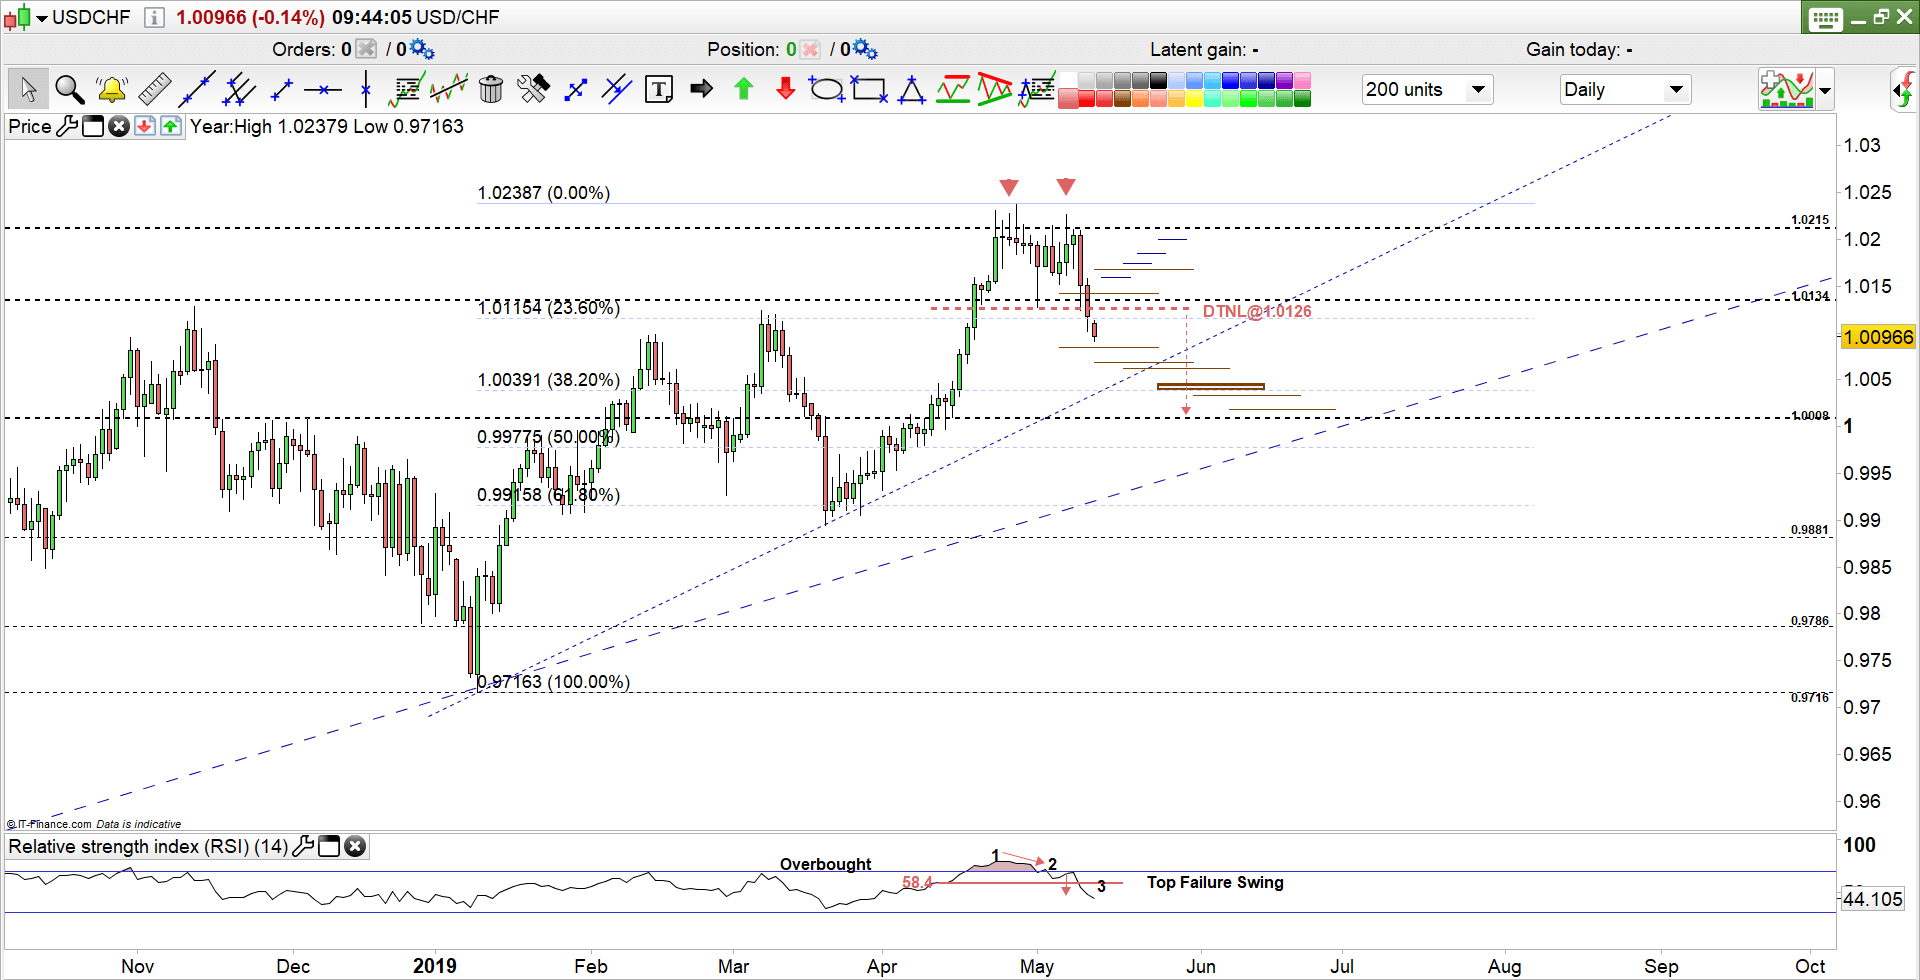
Bearish development after a quiet period of trading
On April 26, USD/CHF rallied to 1.0237, its highest level in almost 28 months, but began pulling back the same day with the buyers likely taking profit. Since hitting that high, up until the past few sessions, price was stuck in a narrow trading range, failing almost every day to break higher.
From May 1-9, USD/CHF twice tested the lower end of the trading range located at 1.0134, and in both cases failed to close below, however, on the second attempt the pair closed at 1.0151 – its lowest close in three weeks. This demonstrated that sellers were gaining control and also caused the Relative Strength Indicator (RSI) to decline below the level mentioned in last week’s article – USD/CHF Trading levels to watch
Bearish momentum was confirmed the following day, on Friday, with the pair closing the week below 1.0134. Meanwhile, RSI continued to fall from 55 to 49, emphasizing the strength of downside momentum. Additionally, a double top pattern was completed on the same day with the price closing below the neckline residing at 1.0126.
To Sum Up: If the price remains below 1.0126, USD/CHF could edge lower towards the vicinity of 1.0018/08, contingent on first clearing the two support zones at 1.0069–10062 and 1.0044–1.0034. What if USD/CHF Closes Above 1.0134? This would negate the double top formation and also have the pair returning to the prior trading range, pushing towards the high end of it located at 1.0215. However, resistance levels at 1.0143, 1.0169, 1.0184, and 1.0201 need to be watched along the way.
USD/CHF 2 Hours Price Chart (May 13, 2019)

Bears in Charge
USD/CHF opened this week’s trading session with a downside breakaway gap, marking the bears’ dominance. Alongside this development RSI is currently at 24, which is in oversold territory .If the pair breaks and remains below 1.0060 it could push towards the 38.2% Fibonacci retracement level at 1.0039. Support levels at 1.0053 and 1.1146 may be worth monitoring.
If bulls can take initiative and push USD/CHF above 1.0100, the next level of significant resistance is at the aforementioned neckline at 1.0126, with minor resistance between those two levels arriving at the 23.6 Fibonacci retracement level of 1.0115.
Written By: Mahmoud Alkudsi
Please feel free to contact me on Twitter: @Malkudsi
Just getting started? See our beginners’ guide for FX traders


