


To receive James Stanley’s Analysis directly via email, please sign up here.
Talking Points:
- USD/CHF Technical Strategy: prior up-trend in question with break below 50% retrace of post-Election move.
- The bullish-trend in Swissy is now in question; but RSI divergence of the recent bearish-move urges caution for bearish continuation approaches.
- If you’re looking for trading ideas, check out our Trading Guides. They’re free and updated for Q1, 2017. If you’re looking for ideas more short-term in nature, please check out our Speculative Sentiment Index Indicator (SSI).
In our last article, we looked at the retracement of the prior up-trend in USD/CHF as price action was testing the 50% retracement of the post-Election move at .9943. And that level comes-in very near another relevant Fibonacci level, as the 61.8% retracement of the major move spanning the 2010 high to the 2011 low is at .9951; producing a very interesting ‘zone’ that had provided numerous instances of resistance in 2016 as the range in USD/CHF continued for much of the year.
As we had noted in that last piece, this confluent zone of support could be considered a line of demarcation for bullish approaches; with breaks below further nullifying the strength that was seen from the initial move, and thereby questioning continuation prospects. This week saw price action in Swissy slide-lower, finally running below this long-term confluent zone; and while buyers did show-up around the .9850 handle to offer quick iteration of short-term support, sellers have come right back as resistance was tested in that prior zone of support. This continues the near-term bearish price action on Swissy, and bulls would likely want to take note.
On the bearish side of the pair, there are flaws as well. The bearish move appears to be getting a bit long-in-the-tooth as RSI on the 4-hour chart is continuing to highlight divergence. And while that prior zone of support is now showing as resistance, the past 24 hours have seen a quick higher-high and higher-low develop around a really heavy economic calendar.
For bearish continuation approaches, traders would likely want either one of two scenarios: A deeper test of resistance around the parity handle, at which point a stop could be set above prior point of resistance around 1.0038; or a fresh-low to indicate that bears can continue driving the pair lower, at which point near-term levels of support could become ideal resistance entries.
On the bullish side of the pair, traders would likely want to see some element of resolution from this recent congestions, letting price action break back-above parity before entertaining top-side approaches.
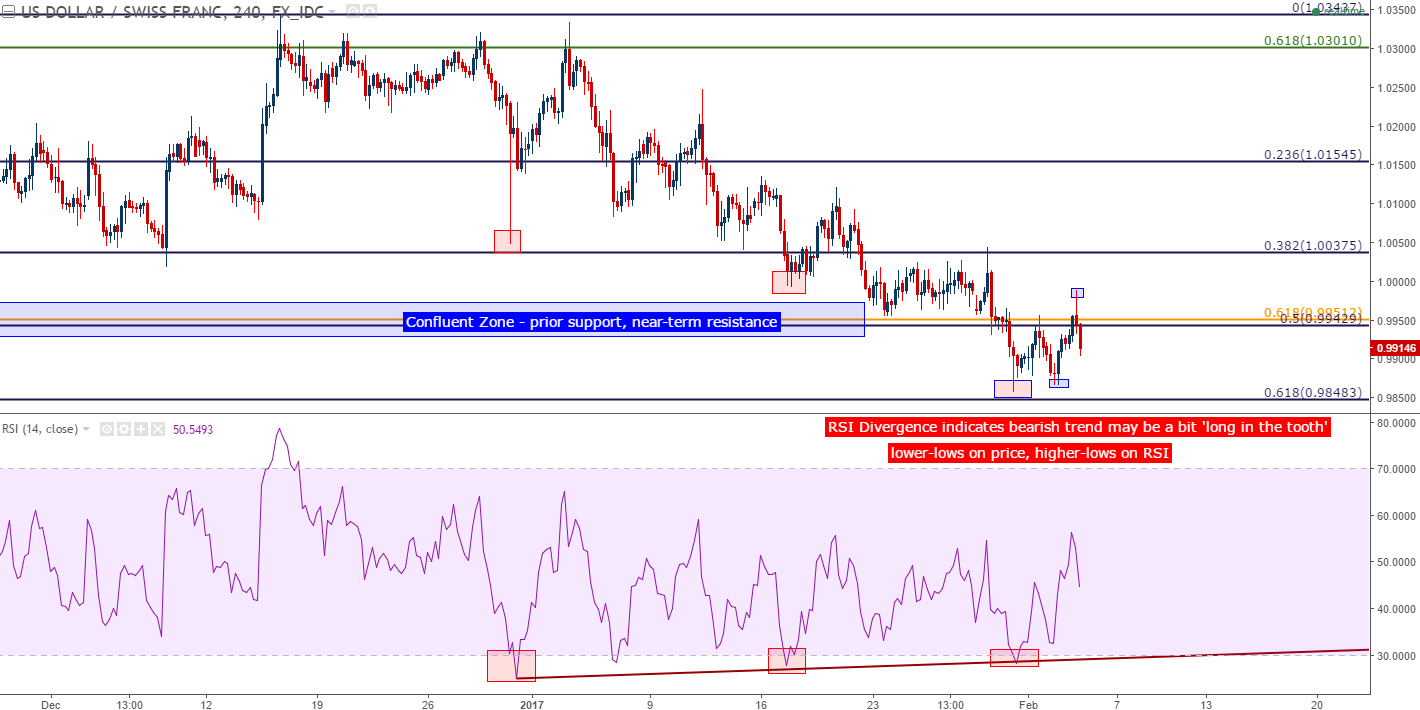
Chart prepared by James Stanley
--- Written by James Stanley, Analyst for DailyFX.com
To receive James Stanley’s analysis directly via email, please SIGN UP HERE
Contact and follow James on Twitter: @JStanleyFX


