


USD/CAD Technical Outlook
USD/CAD – Bull’s Pullback
On Wednesday, surged to a near two weeks high at 1.4173. However, on the following day the price declined and settled below the 1.4000 threshold. On Friday, the weekly candlestick closed in the red with a 1.1% loss.
This week, the Relative Strength Index (RSI) has risen from 45 to 49 highlighting bull’s weakness with bear’s lack of momentum.
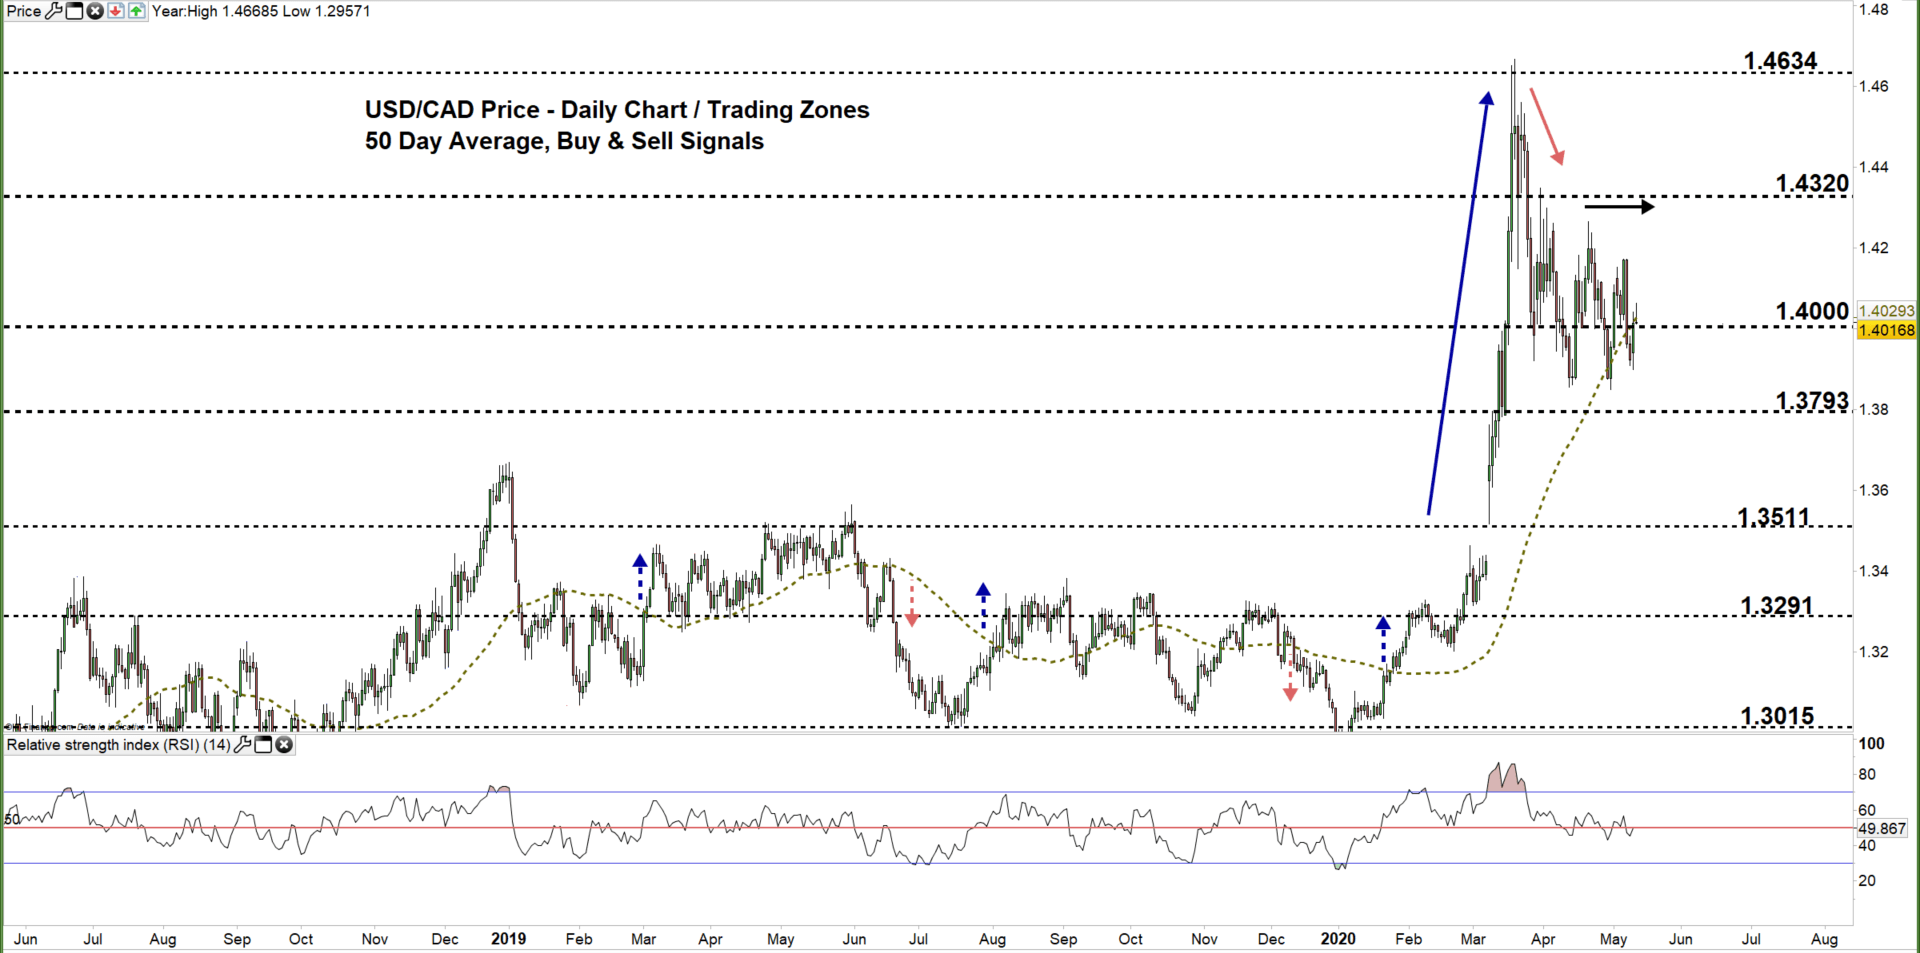
USD/CAD DAILY PRICE CHART (May 30, 2018 – May 12, 2020) Zoomed Out

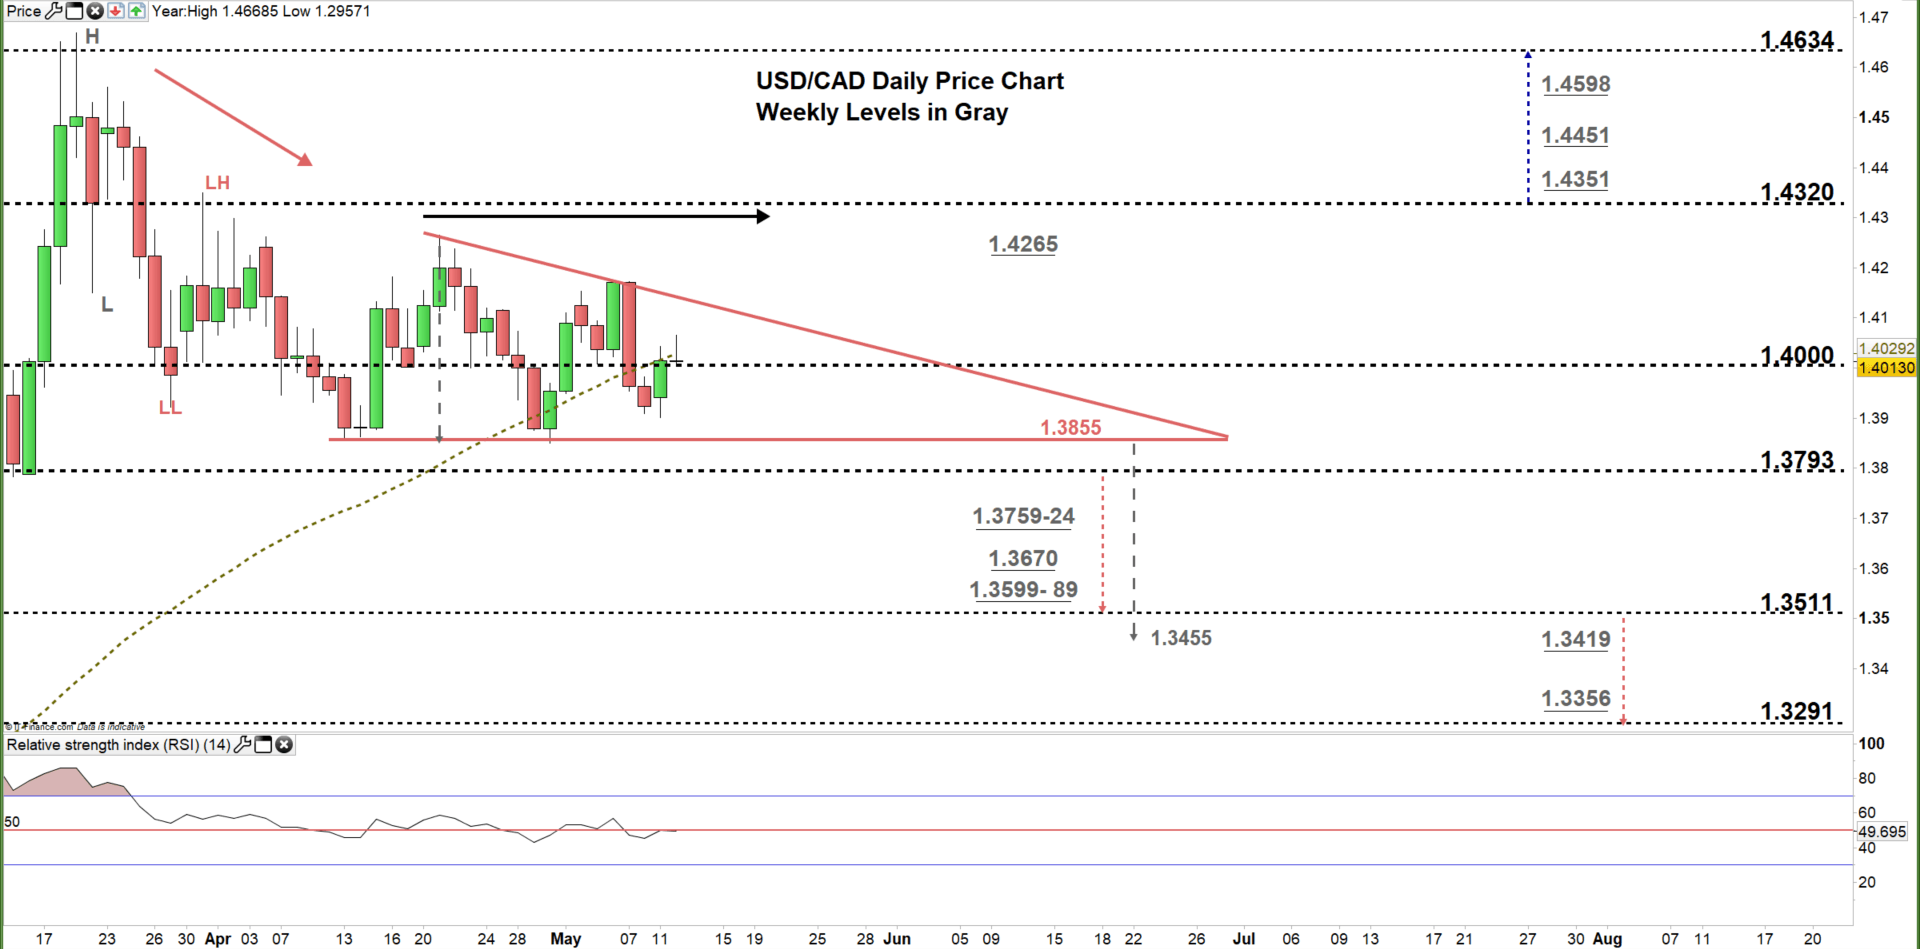
USD/CAD DAILY PRICE CHART (March 17 – May 12, 2020) Zoomed In
From the daily chart we noticed that in late March USD/CAD reversed lower creating lower highs with lower lows. Later on, the price traded in a sideways move and developed a descending triangle pattern.
Yesterday, the pair failed to close above the 50-day moving average signaling hesitation from bull’s side. Today, the market tests returning to the lower trading zone 1.3793 -1.4000. A close below the high end of the zone could encourage bears to press towards the lower line of the aforementioned triangle located 1.3855. A further close below the low end of the zone generates a stronger bearish signal and could send USDCAD even lower towards 1.3511. In that scenario, the weekly support areas and level marked on the chart should be considered.
On the flip side, any failure in closing below the high end of the zone could encourage bulls to push towards 1.4320. A further close above this level may cause a rally towards 1.4634. That said, the weekly resistance levels underlined on the chart should be monitored.
It's noteworthy that, any break above the upper line of the triangle would invalidate this pattern.

USD/CAD four hour PRICE CHART (April 17 – May 12, 2020)

Based on analysis of the four- hour chart, on May 7 USD/CAD broke below the higher uptrend line originated from the April 30 low at 1.3850 then declined. Therefore, any violation of the lower uptrend line originated from the aforementioned low would be considered a bearish signal.
A break below 1.3950 could send USDAD towards 1.3858. Nevertheless, the weekly support level underscored on the chart should be watched closely. In turn, any break in the other direction i.e. above 1.4154 may trigger a rally towards 1.4265. Although, the resistance level located at 1.4179 should be kept in focus.
See the chart to find out more about the key technical levels in a further bullish/bearish scenario.

Written By: Mahmoud Alkudsi, Market Analyst
Please feel free to contact me on Twitter: @Malkudsi


