


USD/CAD Technical Forecast
USD/CAD – Indecisive Traders
On April 13, USD/CAD printed its lowest level in nearly five weeks at 1.3856. However, the price rallied after then closed the weekly candlestick with a Doji pattern highlighting the market’s indecision at this point.
Alongside that, the Relative Strength Index (RSI) rebounded from 50 then pointed higher emphasizing that uptrend momentum was still intact.
USD/CAD DAILY PRICE CHART (July 1, 2018 – April 21, 2020) Zoomed Out


USD/CAD DAILY PRICE CHART (March 9 – April 21, 2020) Zoomed In
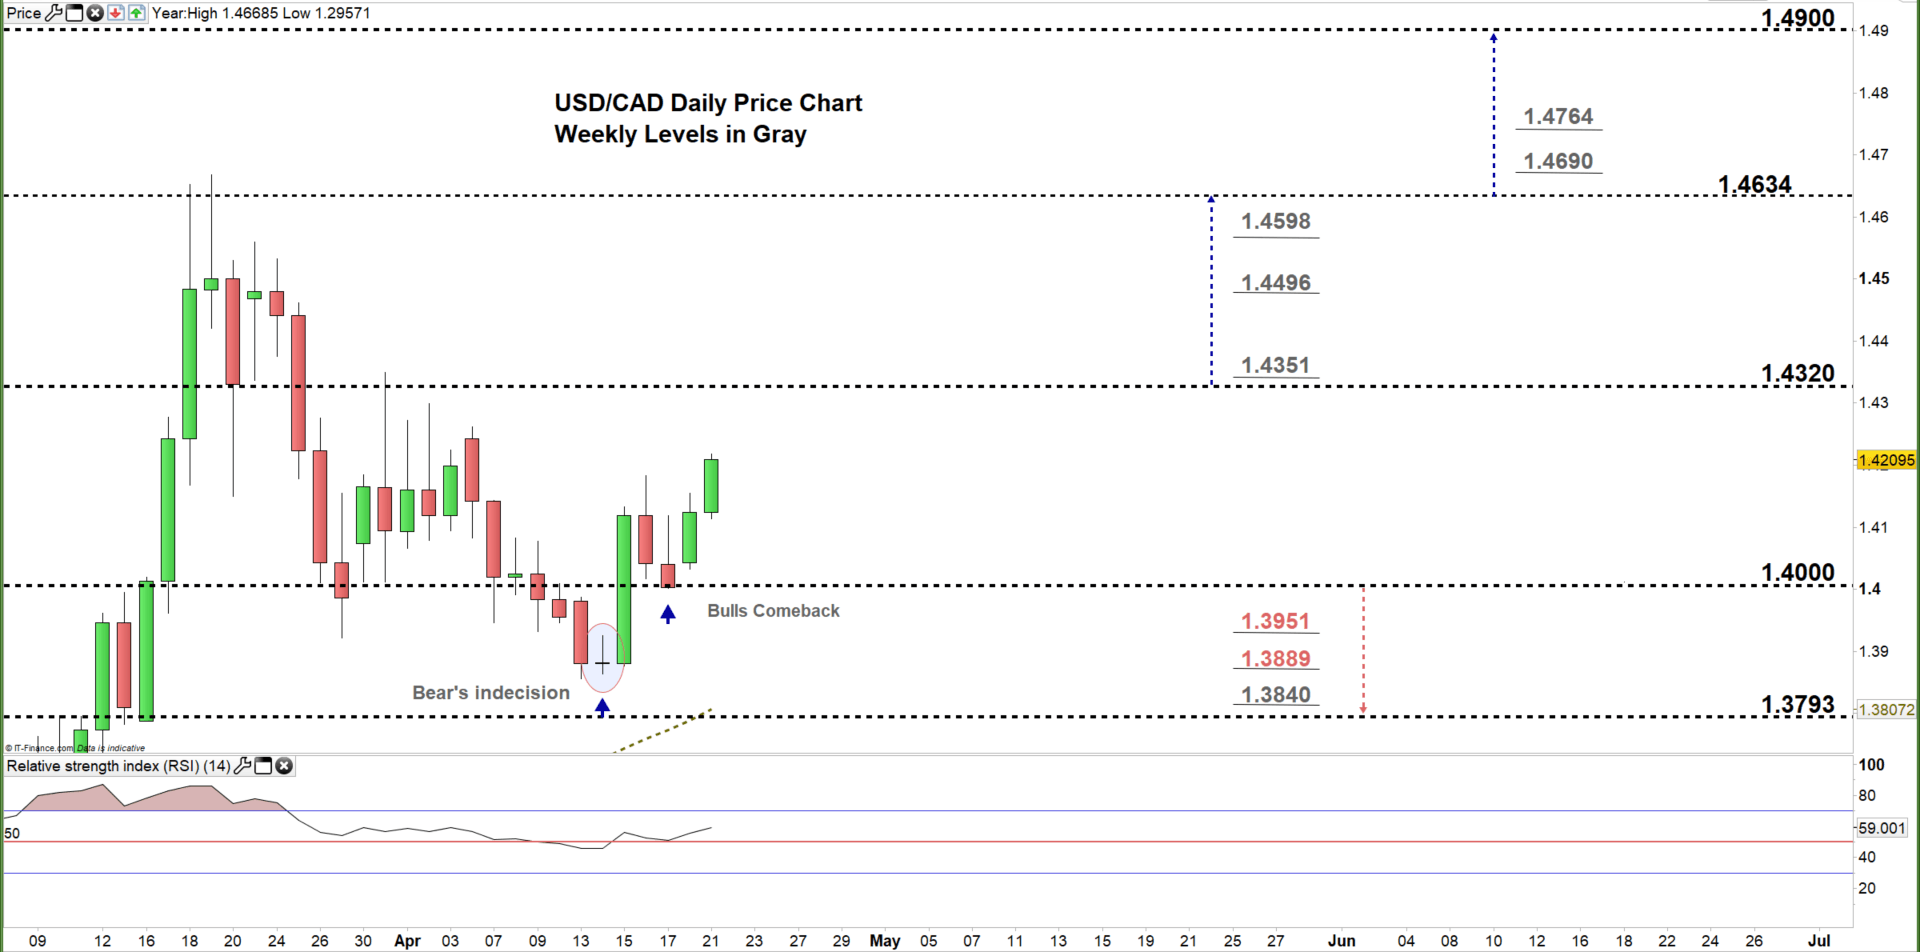
From the daily chart, we noticed on April 14 USD/CAD closed with a Doji pattern reflecting bears indecision at this point. On the following day, the price climbed to the trading zone 1.4000 – 1.4320 then on Friday, the market rebounded from the low end of the zone signaling a reversal in price’s direction towards the high end of the zone.
A close above the high end of the zone may encourage USDCAD bulls to push towards 1.4634. Further close above that level could extend this rally towards 1.4900. In that scenario, the weekly resistance levels underlined on the chart (zoomed in) should be considered.
On the flip side, any failure in closing above the high end of the zone reflects bulls hesitation. This may change the pair’s course towards the low end of the zone. Further close below that level could send USDCAD even lower towards 1.3793. That said, the daily and weekly support levels underscored on the chart should be kept in focus.

USD/CAD four hour PRICE CHART (Mar 30 – April 21, 2020)
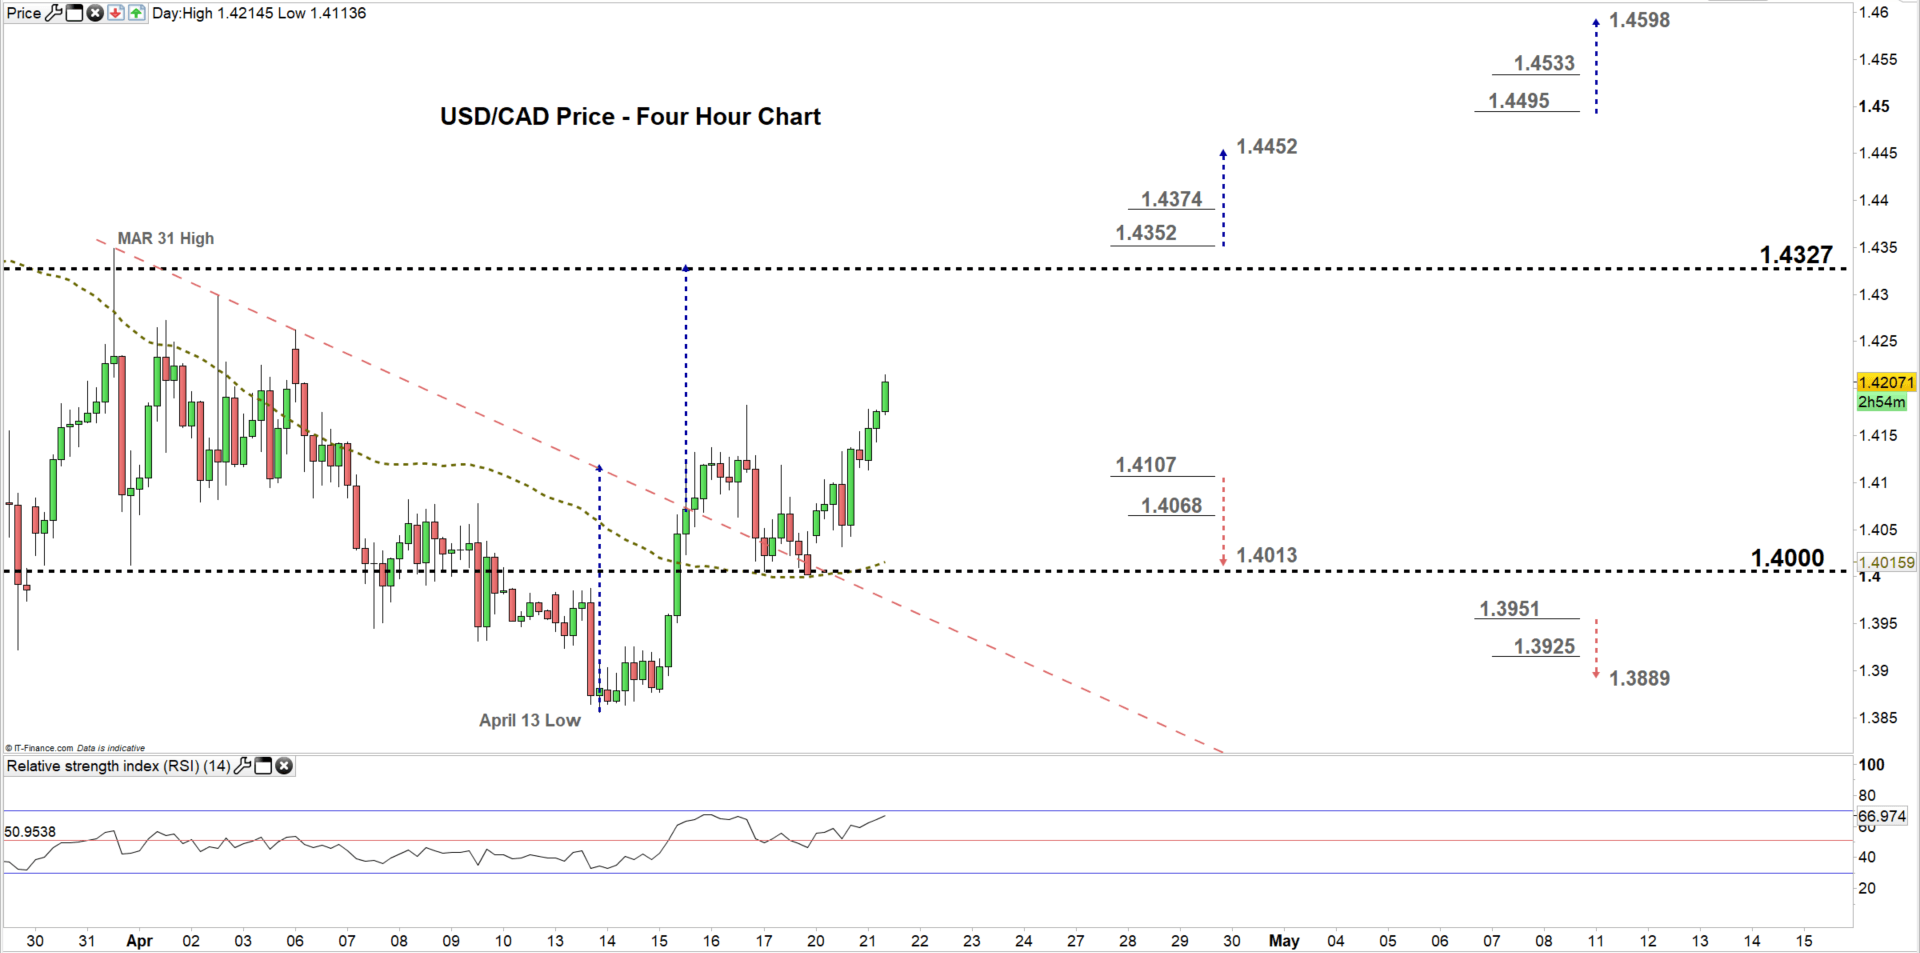
Looking at the four- hour chart, we noticed that on April 15 USD/CAD broke above the downtrend line originated from the March 31 high. The price tested the line on multiple occasions then rallied after eyeing a test of the high end of the current trading zone discussed above on the daily chart.
A break above 1.4352 might push USDCAD towards 1.4452. Nevertheless, the resistance level at 1.4374 should be watched closely. In turn, any break in the other direction i.e. below 1.4107 could send the price towards 1.4013. Although, the daily support level marked on the chart would be worth monitoring.
See the chart to find out more about the key technical levels in a further bullish/bearish scenario.

Written By: Mahmoud Alkudsi
Please feel free to contact me on Twitter: @Malkudsi


