


USD/CAD Technical Outlook
- From Bullish to bearish
- Will USDCAD bears take the initiative?
USD/CAD – Bearish Development
Last week, USD/CAD declined and settled below 1.4000 threshold indicating that bulls had given up control. On Thursday, the price rebounded from its lowest level in two weeks at 1.3931 then rallied after. Yet, in the following day, the weekly candlestick closed in the red with 1.7% loss.
Alongside that, the Relative Strength Index (RSI) crossed below 50 then remained flat after, reflecting a paused downtrend move.
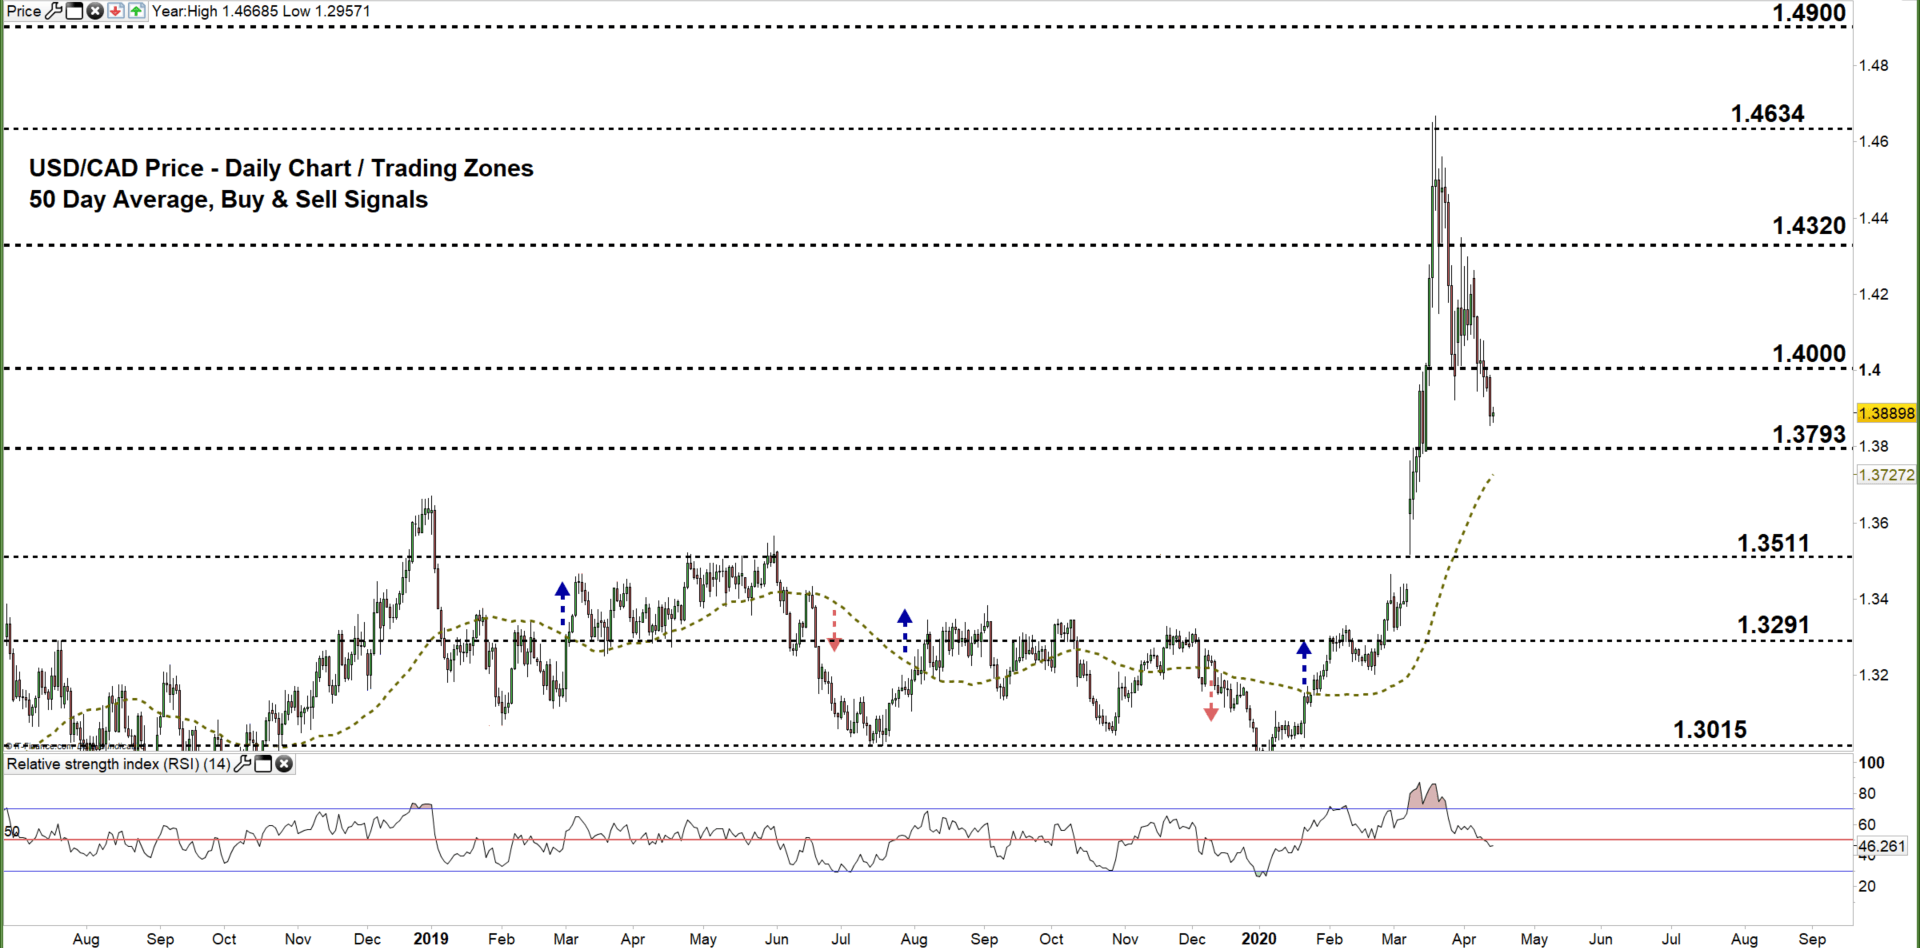
USD/CAD DAILY PRICE CHART (July 1, 2018 – April 14, 2020) Zoomed Out

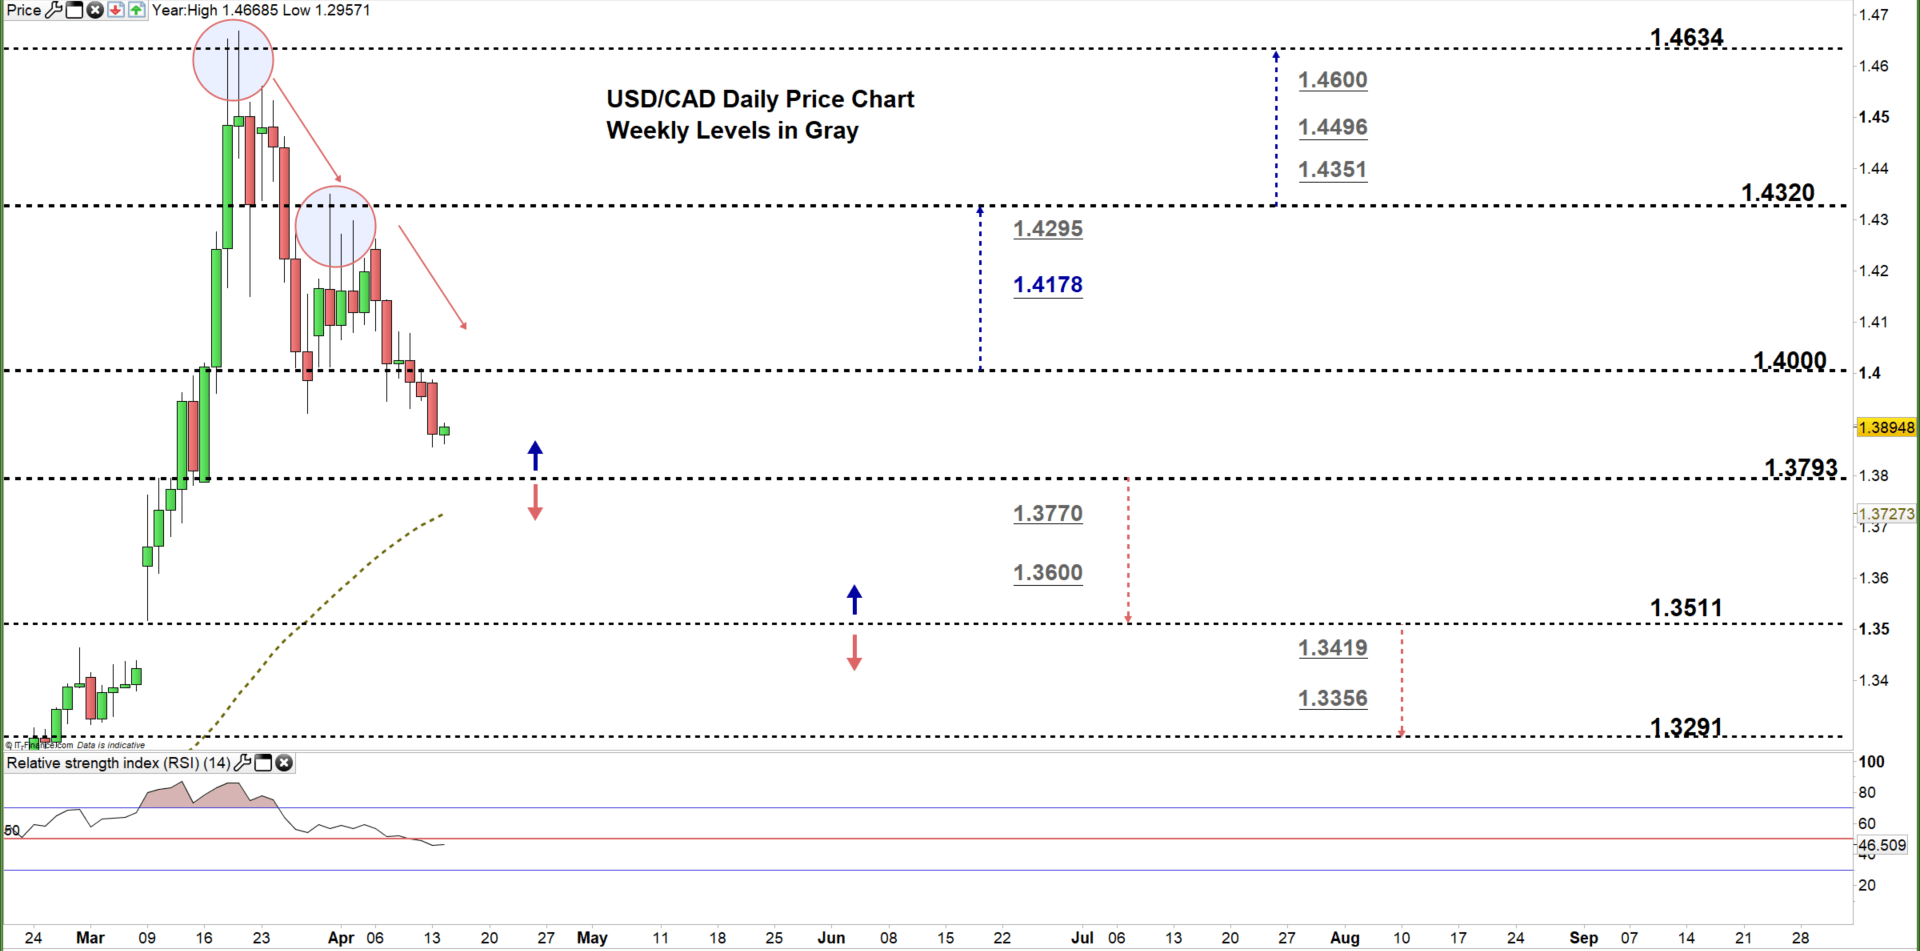
USD/CAD DAILY PRICE CHART (FEB 24 – April 14, 2020) Zoomed In
From the daily chart, we noticed on March 18-19 USD/CAD rallied above 1.4634 yet failed to close above it then fell towards 1.4320 . By the end of March, the pair failed to overtake this level signaling a weak uptrend move. As a result, the price retreated towards 1.4000. Last week, the pair declined to current trading zone 1.3793- 1.4000 eyeing a test of the low end of it.
A close below the low end of the zone could encourage USDCAD bears to press towards 1.3511. Further close below that level may send the price even lower towards 1.3291. Although, the weekly support levels underscored on the chart (zoomed in) should be kept in focus.
On the flip-side, any failure in closing below the low end of the zone could reverse the pair’s direction towards the high end of the zone. Further close above that level may see USDCAD trading towards 1.4320. That said, the daily and weekly resistance levels marked on the chart should be monitored.

USD/CAD four hour PRICE CHART (Mar 24 – April 14, 2020)

Looking at the four- hour chart, we noticed that at the start of last week USD/CAD broke below the uptrend line originated from the March 27 low at 1.3922, then started a downtrend move creating lower highs with lower lows.
Thus, a break below 1.3770 might continue bearish price action towards 1.3670. Yet, the support level at 1.3723 should be considered. In turn, any break in the other direction i.e. above 1.4013 would correct current downtrend and may cause a rally towards 1.4118. Yet, the daily resistance level underlined on the chart should be watched closely.
See the chart to find out more about the key technical levels in a further bullish/bearish scenario.

Written By: Mahmoud Alkudsi
Please feel free to contact me on Twitter: @Malkudsi


