


USD/CAD Price Technical Forecast
- At its highest level since May 2017
- Bulls need to consider these levels to keep controlling the price action
USD/CAD- Soars to Multi-Month High
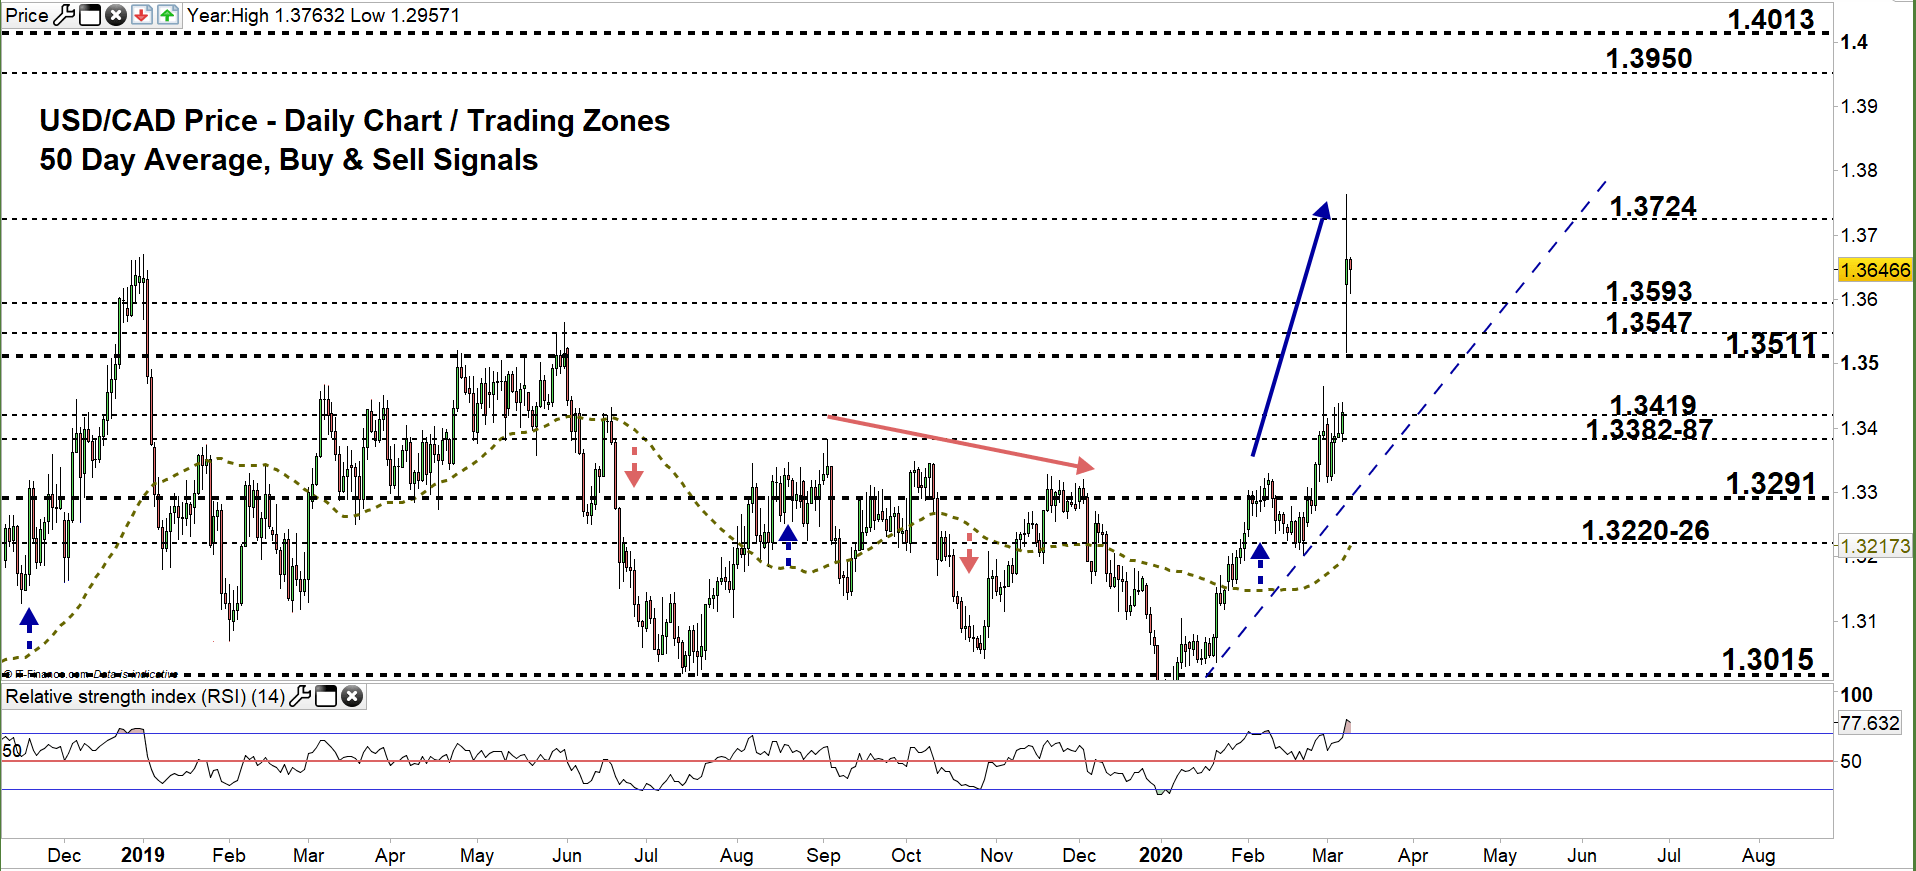
Last week, USD/CAD fell to 1.3315 then recovered all its losses and closed the weekly candlestick with a bullish Doji pattern, highlighting that bulls were not done. This week, the price rallied to 1.3763- its highest level in over two and half years.
Alongside that, the Relative Strength Index (RSI) crossed above 70 and remained in overbought territory, emphasizing the strength of uptrend momentum.
USD/CAD DAILY PRICE CHART (DEC 1, 2018 – Mar 10, 2020) Zoomed Out

USD/CAD DAILY PRICE CHART (DEC 12 – Mar 10, 2020) Zoomed In
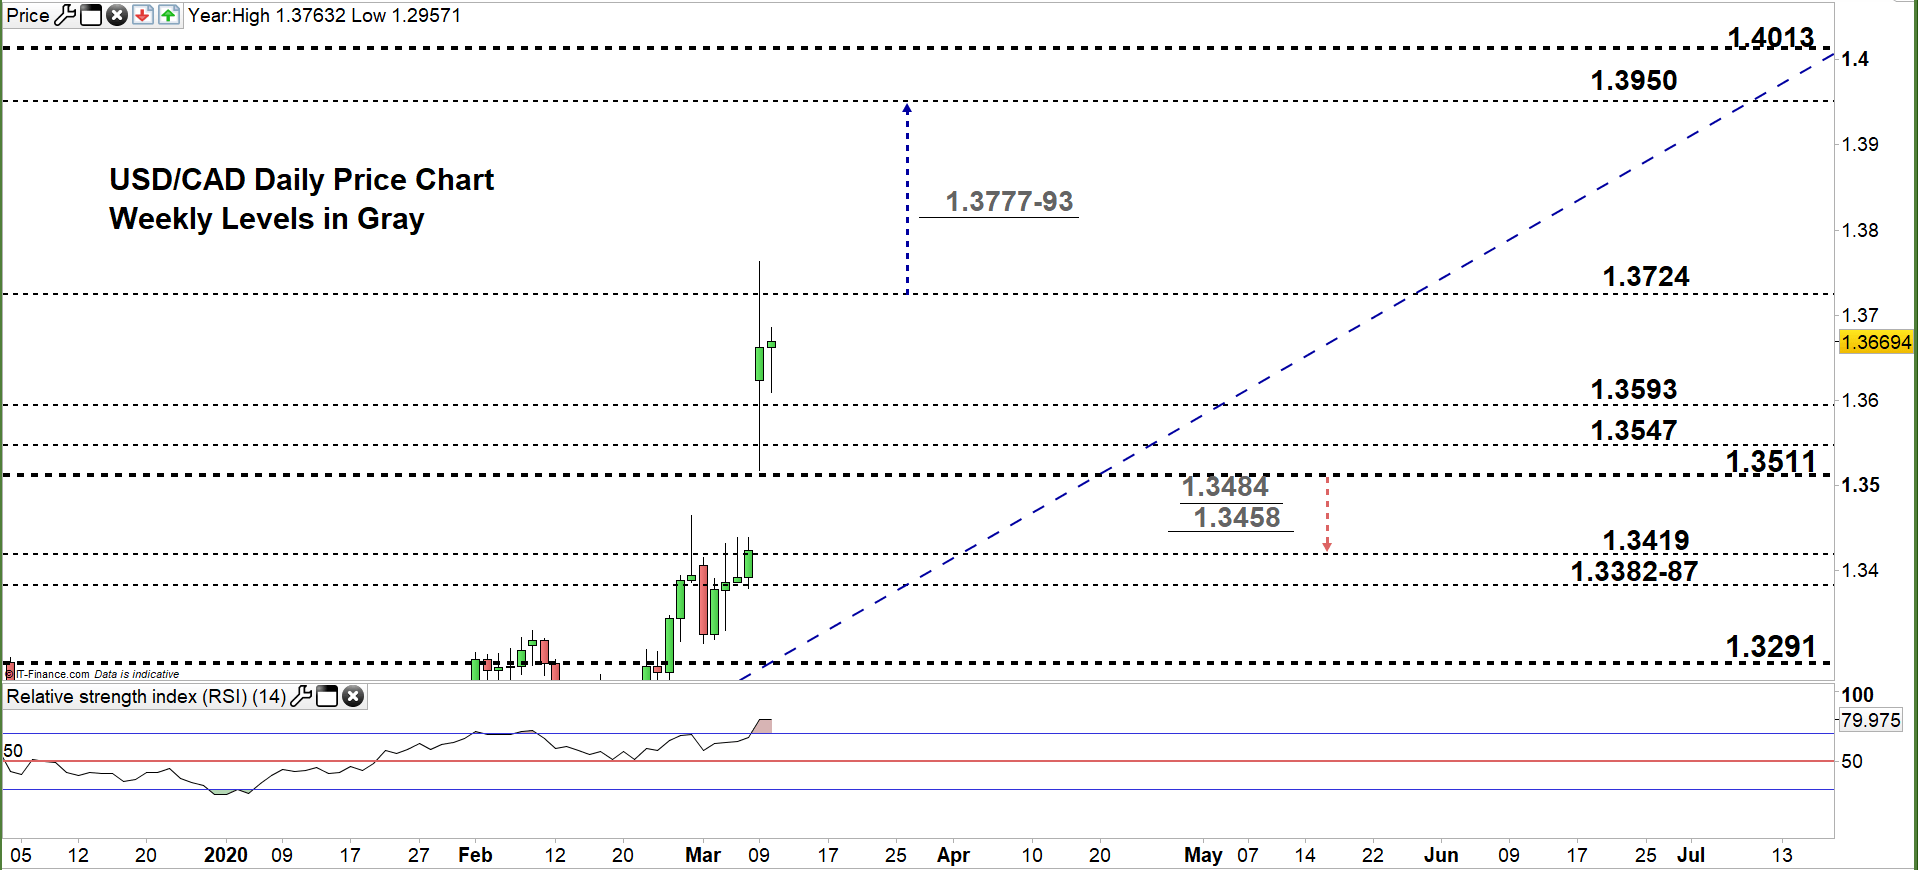
From the daily chart, we noticed that this week USD/CAD has opened with a gap to the upside and moved to a higher trading zone 1.3593 – 1.3724. The price broke above the high end of the zone then retreated after, as some bulls seemed to cut back.
Therefore, the pair could be on its way for a test of the low end of the zone. A close below that level may lead more bulls to exit the market. As such, USDCAD could fall towards 1.3547. Further close below 1.3511 opens the door for the pair to decline towards 1.3291. Yet, the daily support level and zone/s marked on the chart (zoomed in) should be considered.
On the other hand, any close above the high end of the zone could lead to more bullishness towards 1.3950. That said, the weekly resistance zone marked on the chart should stay in focus, as some traders might exit/join the market around these points.

USD/CAD four hour PRICE CHART (FEB 27 – Mar 10, 2020)

Looking at the four- hour chart, we notice that USD/CAD reversed lower as created yesterday a lower low at 1.3517 and today a lower high at 1.3709.
Hence, a break below 1.3586 could send USDCAD even lower towards 1.3547. Although, the daily support level underlined o the chart should be monitored. On the flip-side, a break above 1.3735 might cause a rally towards 1.3765. Nevertheless, the daily resistance level underscored on the chart should be watched closely.
See the chart to find out more about key levels to monitor in a further bullish/bearish move.

Written By: Mahmoud Alkudsi
Please feel free to contact me on Twitter: @Malkudsi


