


US Dollar vs Canadian Dollar Technical Analysis
USD/CAD – Bulls Still in Charge
On Friday, USD/CAD rallied to its highest level in nearly eight weeks at 1.3253 then closed the weekly candlestick in the green for the fifth week in a row. Yesterday, the pair overtook 1.3300 handle and printed its highest level in two months.
This week, the Relative Strength Index (RSI) rose to 71 highlighting the strength of uptrend momentum.
USD/CAD DAILY PRICE CHART (April 5, 2018 – FEB 4, 2020) Zoomed Out
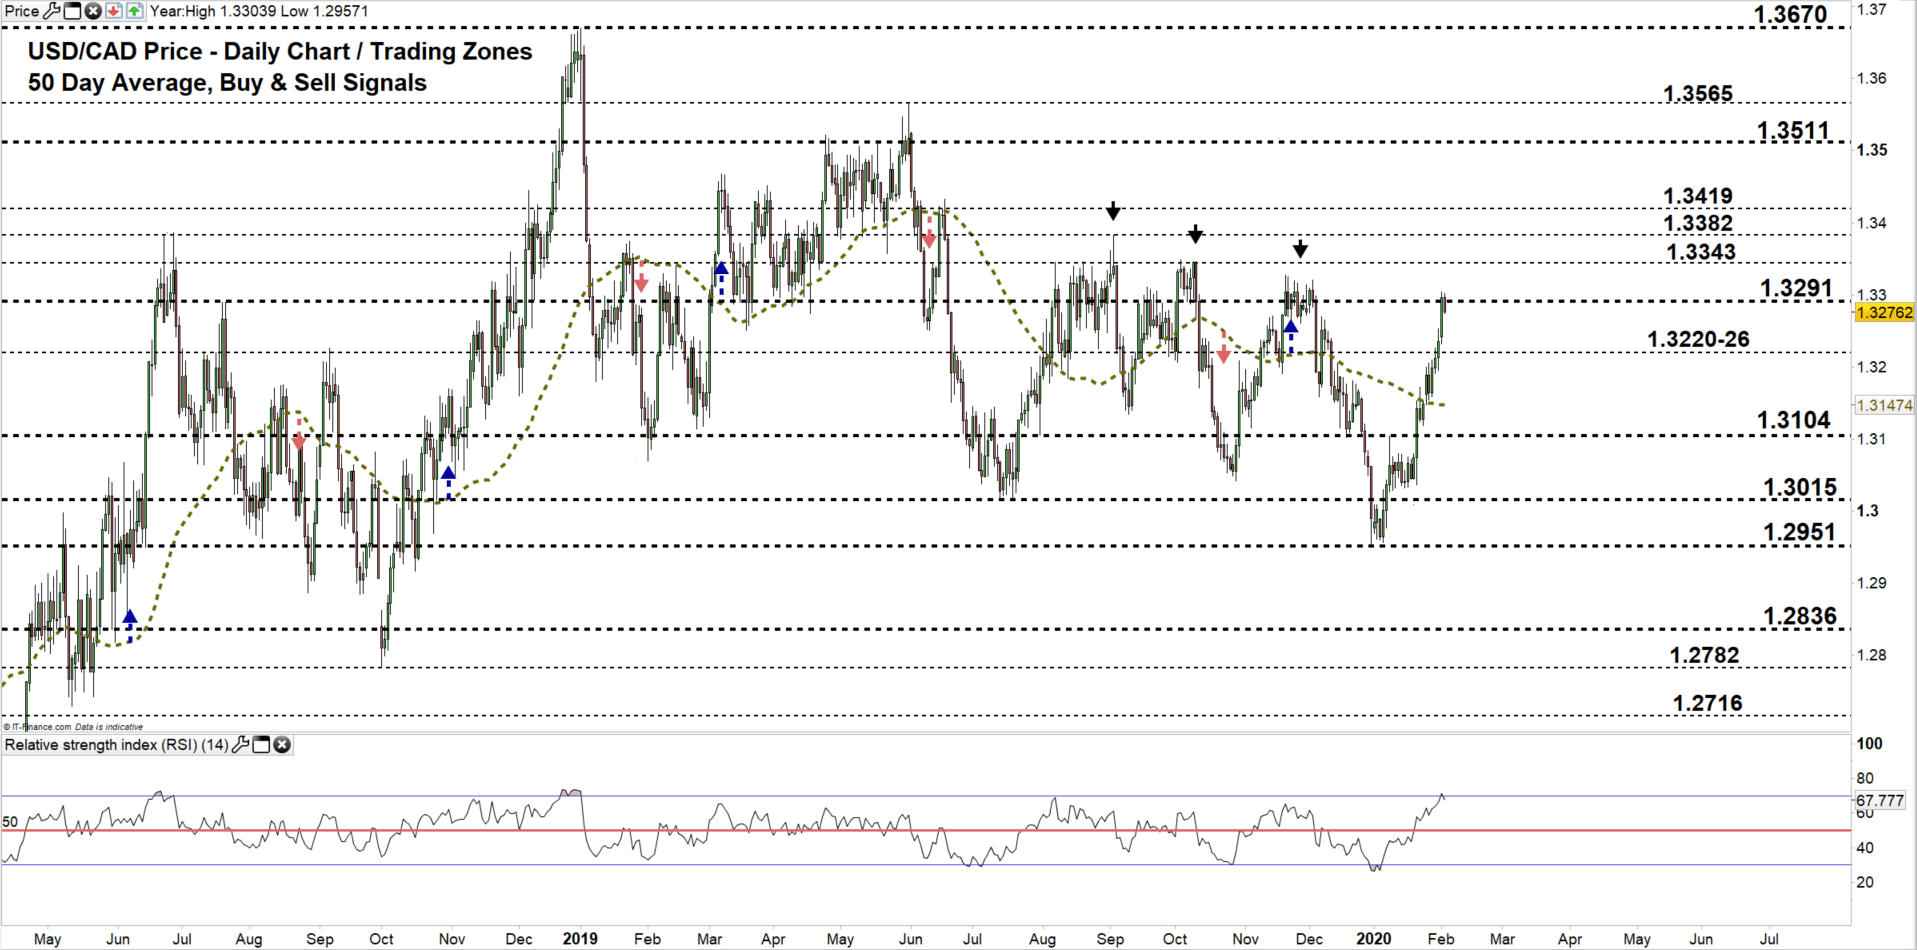

USD/CAD DAILY PRICE CHART (Nov 7– FEB 4, 2020) Zoomed In

From the daily chart, we noticed that on Jan 27 USD/CAD opened with a breakaway gap to the upside then closed above the 50-day average producing two bullish signals. This week, the market added more bullish signals as it opened with a runaway gap then rushed to a higher trading zone 1.3291-1.3343.
Currently, the pair is facing the same zone where it failed late Nov-early Dec of last year. Based on the aformentioned bullish signals, it’s possible that USDCAD bulls may lead the price towards the high end of the zone. Further close above this level, may encourage bulls to push towards 1.3382. That said, the weekly resistance levels underlined on the chart (zoomed in) should be considered.
In turn, a close below the low end of the zone reflects bull’s reluctance. This could reverse USDCAD course towards the vicinity of 1.3220-26. Further close below this area could lead more bulls to exit the market and open the door for bears to press towards 1.3104. In that scenario, the weekly support levels underscored on the chart should be monitored as some traders may join/exit around theses points.

USD/CAD four hour PRICE CHART (Jan 6 – FEB 4, 2020)
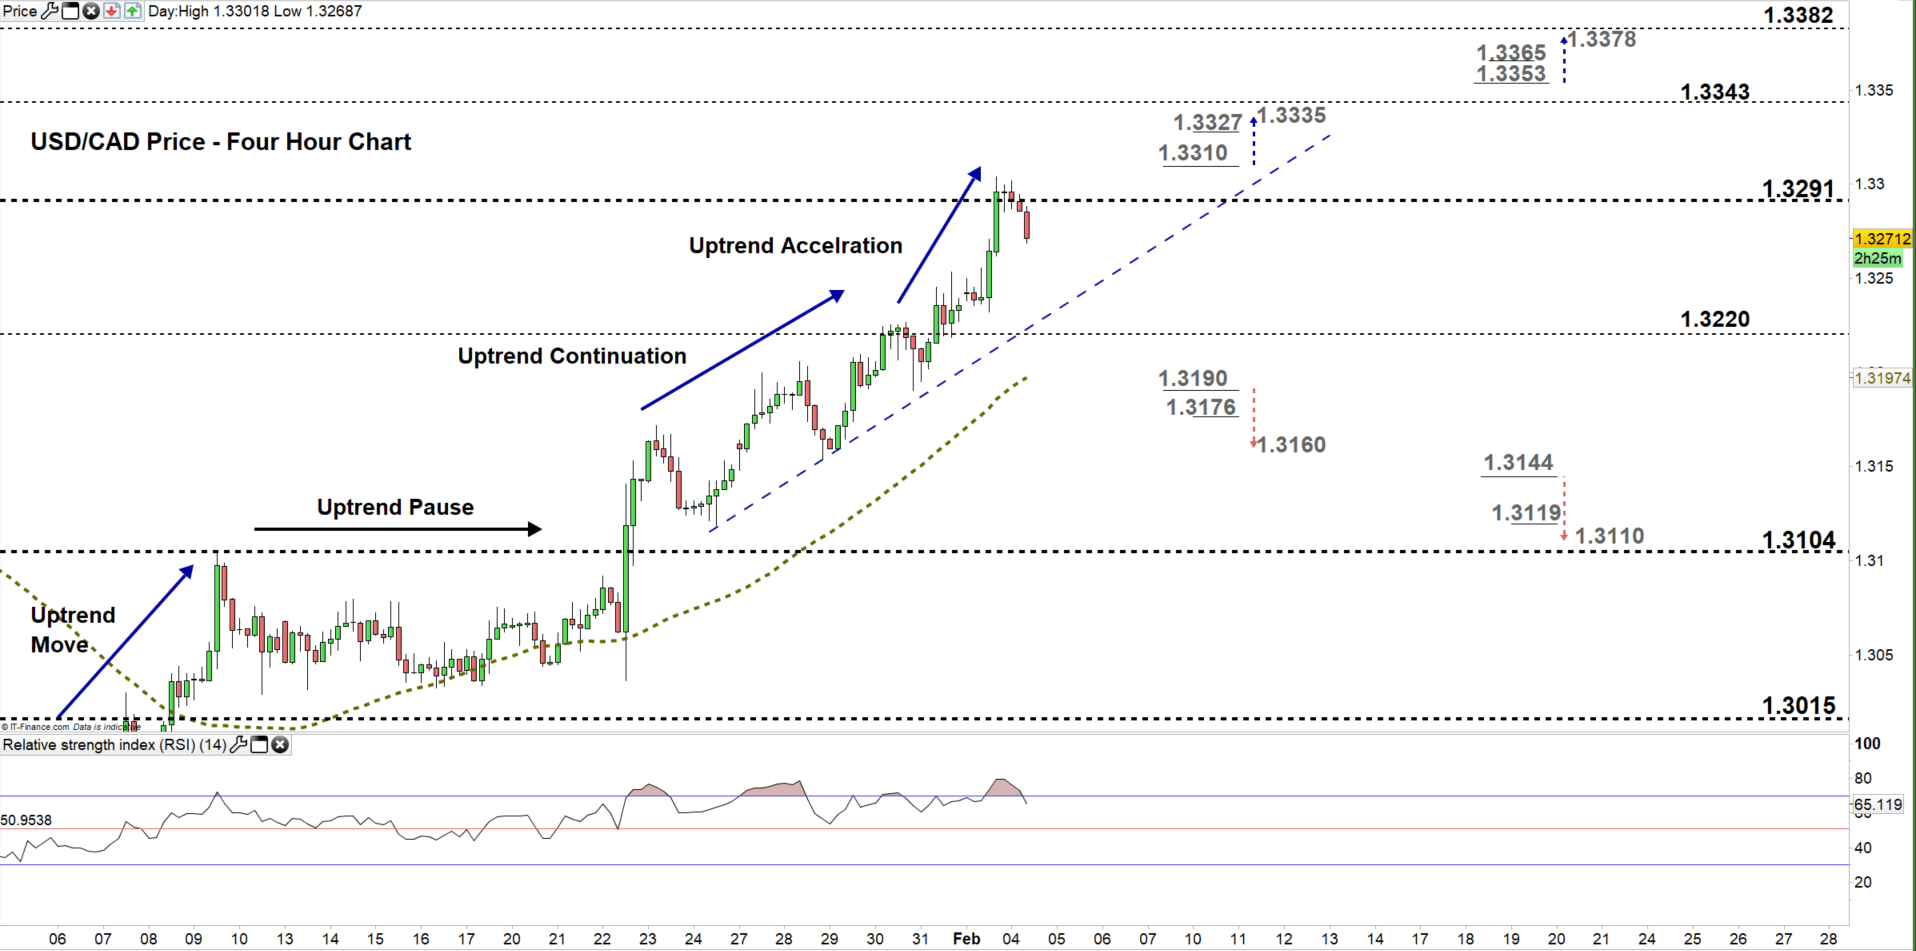
Looking at the four- hour chart, we notice on Jan 22 USD/CAD resumed bullish price action. This week, uptrend move has accelerated and led the price to its highest level in 2020.
A break above 1.3310 could cause a rally towards 1.3335. Yet, the weekly resistance level marked on the chart should be kept in focus. On the flip side, a break below the Jan 30 low at 1.3190 may send the price towards 1.3160. Nevertheless, the daily support level underlined on the chart should be watched closely.
See the chart to figure out more about key levels to monitor in a further bullish/bearish move.
Written By: Mahmoud Alkudsi
Please feel free to contact me on Twitter: @Malkudsi


