


US Dollar vs Canadian Dollar Technical Outlook
- USD/CAD chart highlights that bulls now in control
- Levels and thresholds to consider
USD/CAD – Bulls Comeback
Last week, USD/CAD rallied to 1.3171 – its highest level in over four weeks. On Friday, the price closed the weekly candlestick in the green with 0.6% gain. This week, the market opened with an upward gap reflecting the bullish outlook of the market.
Alongside that, the Relative Strength Index (RSI) rose from 55 to 62 indicating that USDCAD bulls were in control.
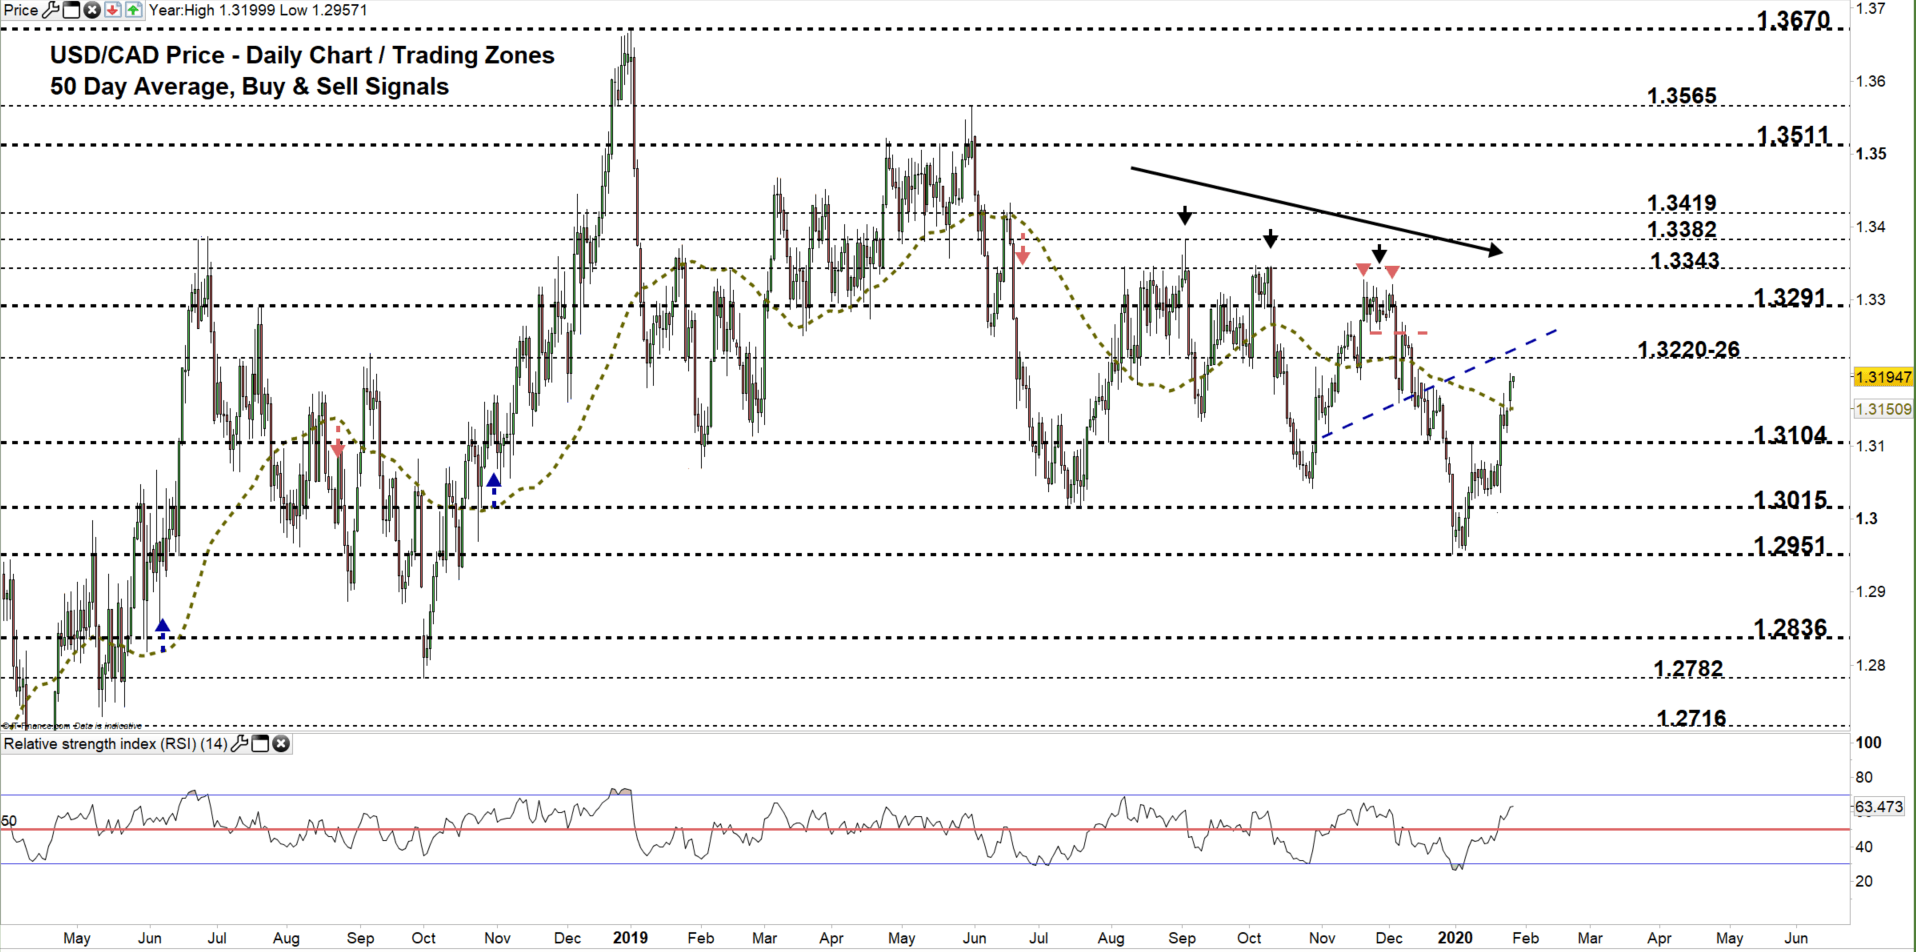
USD/CAD DAILY PRICE CHART (April 5, 2018 – Jan 28, 2020) Zoomed Out

USD/CAD DAILY PRICE CHART (OCT 11– Jan 28, 2020) Zoomed In
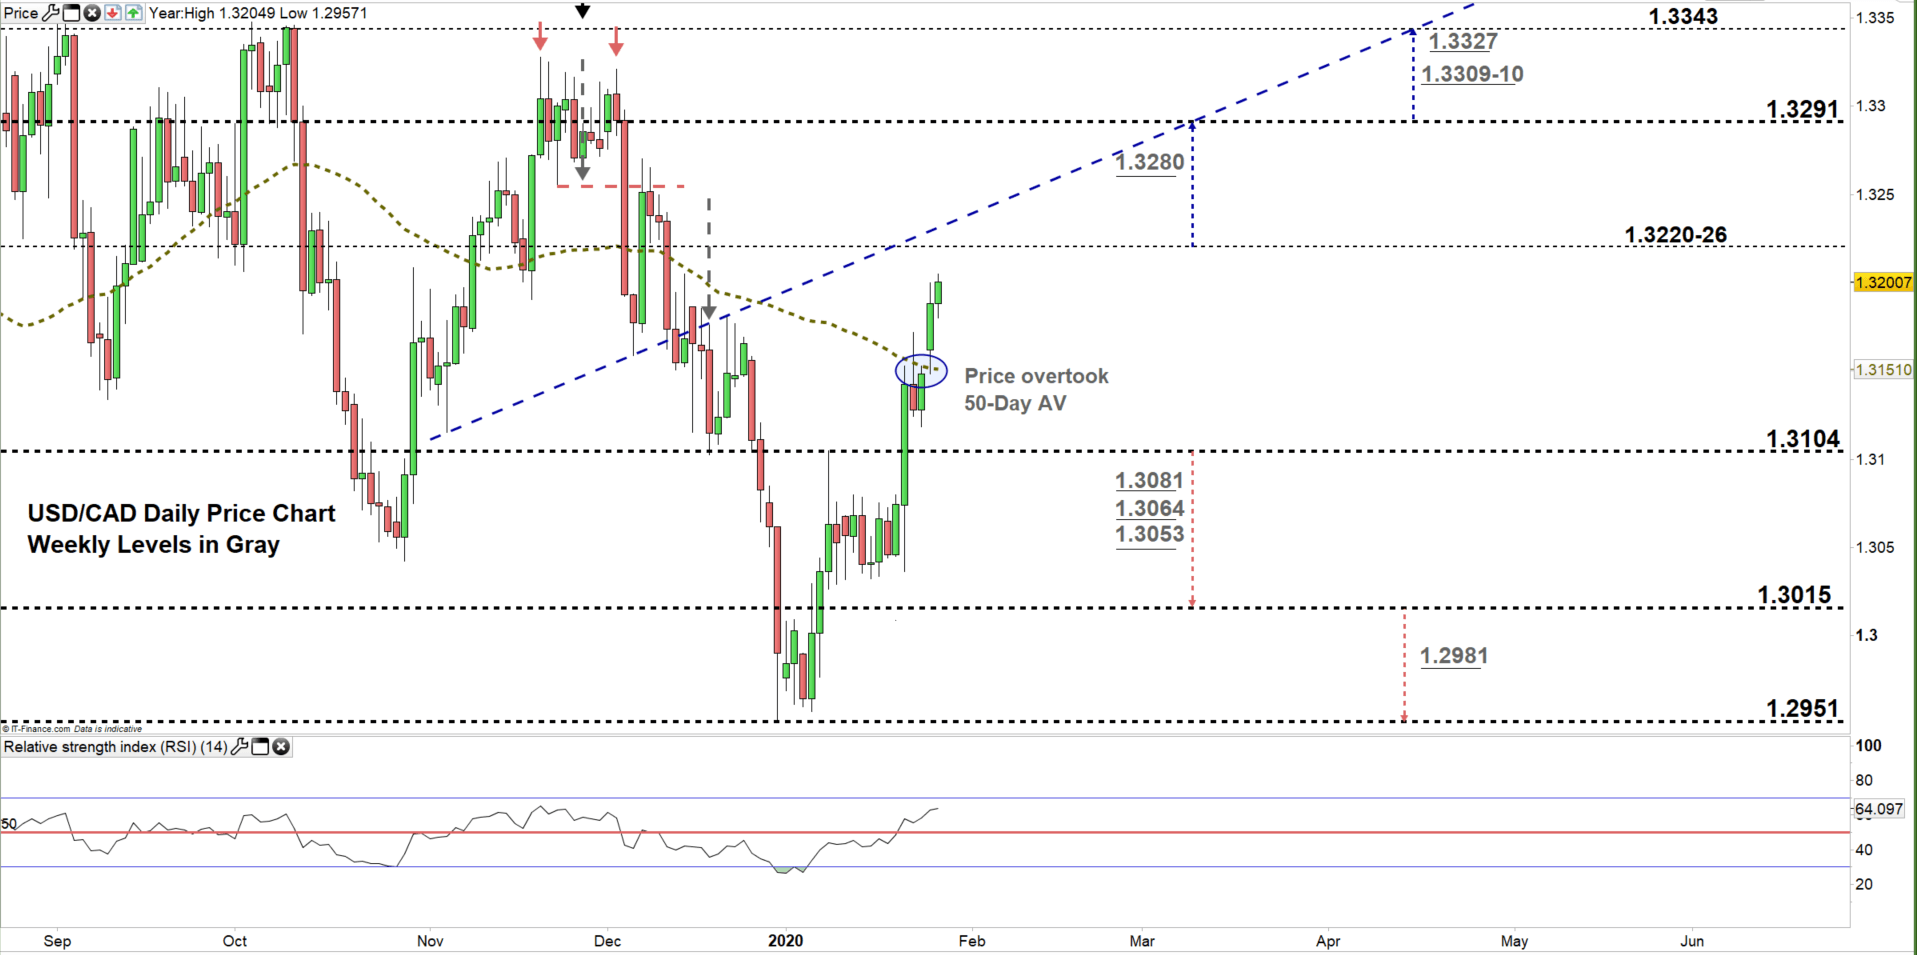
From the daily chart, we noticed that on Jan 22 the market surged to a higher trading zone 1.3104 – 1.3220 eyeing a test of the high end of it. Yesterday, USD/CAD bulls rallied the price then forced a close above the 50-Day average.
A close above the high end of the zone, may encourage bulls to push USD/CAD towards 1.3291. Further close above this level could entice more bulls to join the market towards 1.3343. That said, the weekly resistance levels and area marked on the chart (zoomed in) should be considered as some traders might join/exit the market around these points.
In turn, any failure in closing above the high end of the zone signals bull’s hesitation. This could lead some of them to cut back and reverse the pair’s direction towards the low end of the zone. Further close below this level opens the door for bears to lead USDCAD towards 1.3015 contingent on clearing the weekly support levels underlined on the chart.

USD/CAD four hour PRICE CHART (DEc 30 – Jan 28, 2020)

Looking at the four- hour chart, we notice that on Jan 8 USD/CAD started uptrend move carving out a higher high at 1.3104 then paused after. The market resumed this move on Jan 23 and created another higher high at 1.3171.
Thus, a break above 1.3226 may cause more bullishness towards 1.3264. Yet, the resistance level underlined on the chart should be watched closely. On the other hand, a break below 1.3160 might press USDCAD towards 1.3132. Nevertheless, the daily support level underscored on the chart would be worth monitoring.
See the chart to figure out more about key levels to monitor in a further bullish/bearish move.
Written By: Mahmoud Alkudsi
Please feel free to contact me on Twitter: @Malkudsi


