


Canadian Dollar Forecast
- Canadian Dollar price action against US Dollar
- USD/CAD technical analysis and chart

USD/CAD – Paused Downtrend Move
Last week, USD/CAD rallied and closed the weekly candlestick in the green for the first time in seven weeks with nearly 0.4% gain. This week, the price has moved ineffectively reflecting market’s indecision at this stage.
Alongside that, the Relative Strength Index (RSI) remained flat below 50 signaling to hesitant sellers in a bearish market.
Just getting started? See our Beginners’ Guide for FX traders
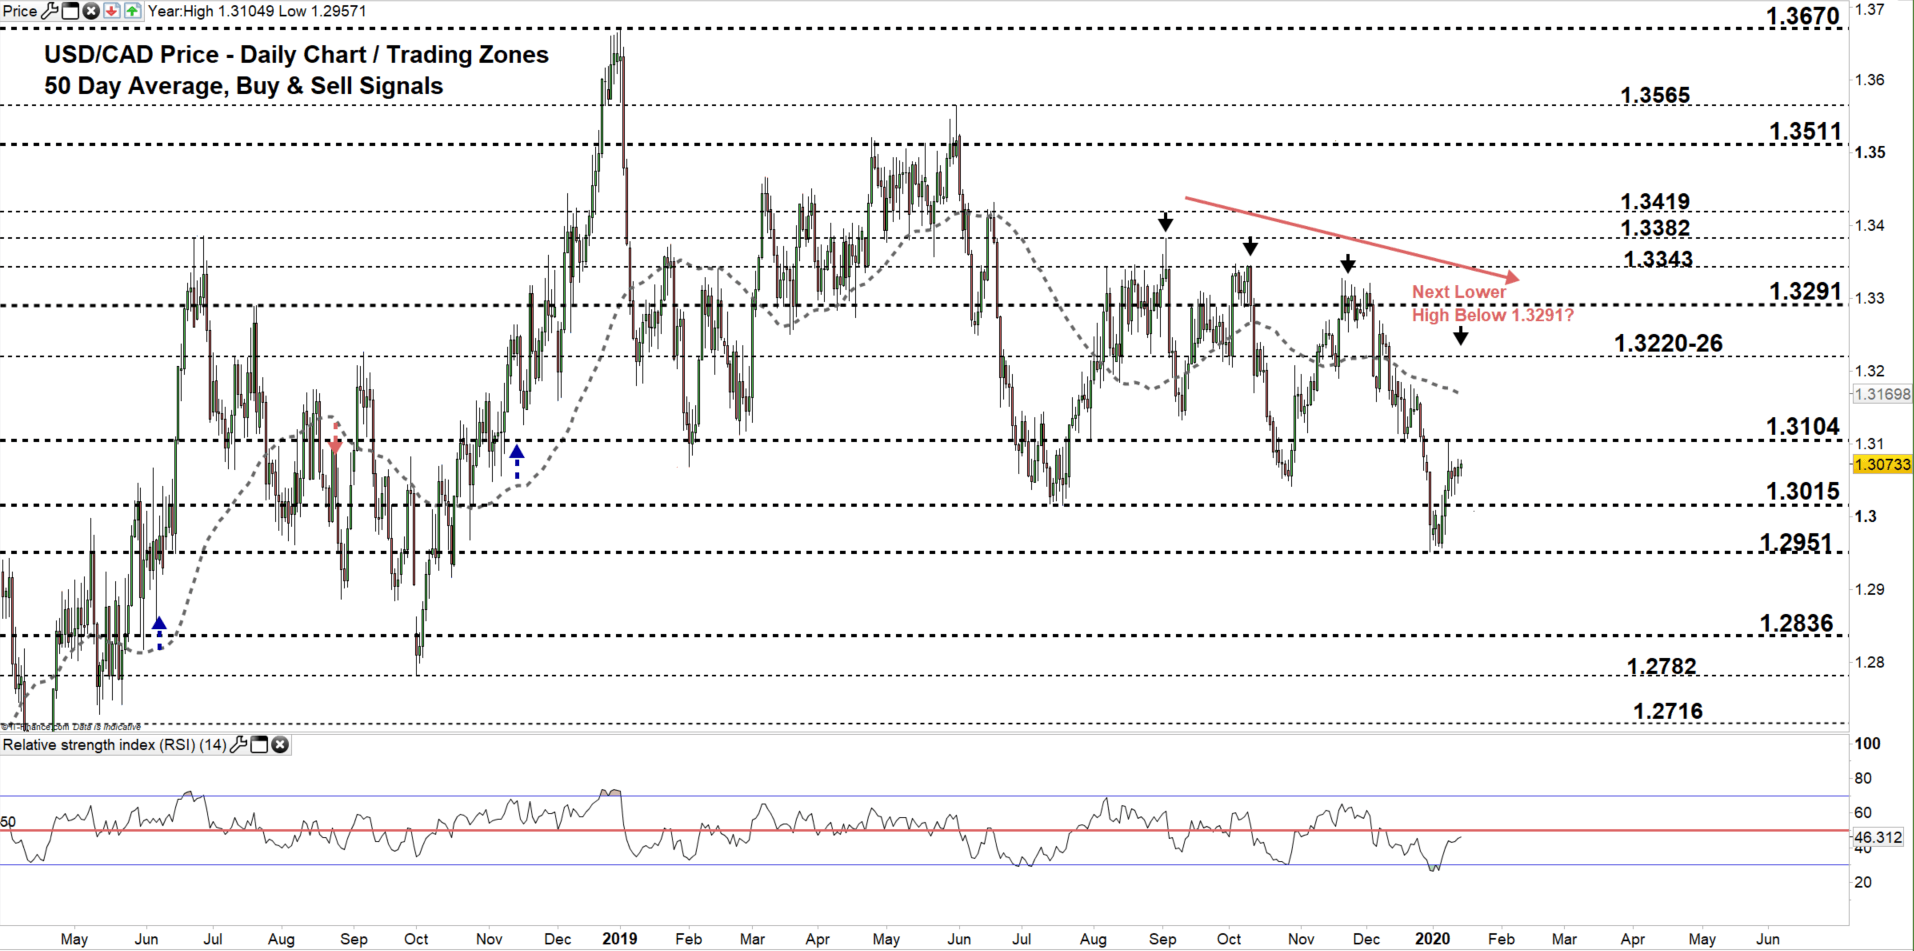
USD/CAD DAILY PRICE CHART (April 5, 2018 – Jan 15, 2020) Zoomed Out
USD/CAD DAILY PRICE CHART (OCT 17– JAN 15, 2020) ZOOMED IN

From the daily chart, we notice that since late Q2-19 USD/CAD has been creating highs and lower highs highlighting long term down trend move. See the chart (zoomed out).
This led the pair on Dec 31 to print its lowest level in over fourteen months at 1.2951. The price rallied after as some sellers took profit. Last week, USDCAD resumed its rally as more sellers exited the market. On Thursday, the pair rebounded from the high end of current trading zone 1.3015 – 1.3104. then pointed lower eyeing a test of the low end of the zone.
A close below the low end of the zone could persuade sellers to press USDCAD towards 1.2951. Further close below this level may resume bearish price action and send the pair towards 1.2836. Having said that, the daily and weekly support levels underlined on the chart (zoomed in) should be monitored as some traders may exit/enter their trades nearby these points.
On the flip side, a close above the high end of the zone may lead more sellers to exit the market. This paves the way for buyers to push USDCAD towards the vicinity of 1.3220-26. Nevertheless, the weekly resistance level and area marked on the chart should be watched along the way.
Having trouble with your trading strategy? Here’s the #1 Mistake That Traders Make
USD/CAD four hour PRICE CHART (DEc 30 – Jan 15, 2020)

Looking at the four- hour chart, we notice since Jan 7 USD/CAD started uptrend move creating higher highs with higher lows. On Friday, USD/CAD paused its uptrend move and carved out a lower high at 1.3075.
This week, the price leaned to the upside developing a possible double top pattern. Any violation of the neckline could reverse USDCAD direction and press it towards the Dec 31 low at 1.2951. Its worth noting that, any rally above 1.3104 would negate the pattern.
A break below 1.3000 handle could lead USD/CAD towards 1.2955. Although, the daily support level underscored on the chart should be watched closely. On the other hand, a break above 1.3119 may push the price towards 1.3160. Yet, the weekly resistance level underscored on the chart would be worth monitoring.
See the chart to know more about key levels to monitor in a further bullish/bearish move.

Written By: Mahmoud Alkudsi
Please feel free to contact me on Twitter: @Malkudsi


