


USD/CAD Price Outlook
Check out our Q3 USD and Gold forecasts . Download for free main currencies and commodities trading guides.
USD/CAD – Buyers Pull Back
On Wednesday USD/CAD rallied to 1.3345 – its highest level in seven weeks. However, the pair slipped back after, then settled below 1.3300 handle reflecting buyer’s hesitation to continue rallying the price.
Alongside this, the Relative Strength Index (RSI) dropped sharply from 68 to 56 emphasizing the buyer’s loss of momentum.
Just getting started? See our Beginners’ Guide for FX traders
USD/CAD DAILY PRICE CHART (AUG 8, 2017 – AUG 9, 2019) Zoomed Out

USD/CAD DAILY PRICE CHART (May 21 – AUG 9, 2019) Zoomed In

Looking at the daily chart, we notice yesterday USD/CAD declined to a lower trading zone 1.3166 – 1.3256. Currently, the pair eyes a test of the low end of the zone.
Thus, a close below the low end of this zone could send the price towards 1.3124. Nonetheless, the weekly support level marked on the chart (Zoomed in) needs to be kept in focus. Further close below 1.3124 could press USD/CAD towards 1.3064. The weekly support levels underlined on the chart should be considered.
On the other hand, a close above the high end of the zone could push the price towards 1.3284. Although, the daily resistance level underscored on the chart (Zoomed in) needs to be monitored. Further close above 1.3284 may cause a rally towards 1.3357. The daily resistance levels underlined on the chart would be worth monitoring.
Having trouble with your trading strategy? Here’s the #1 Mistake That Traders Make
USD/CAD Four-HOUR PRICE CHART (JUly 15 – AUg 9, 2019)
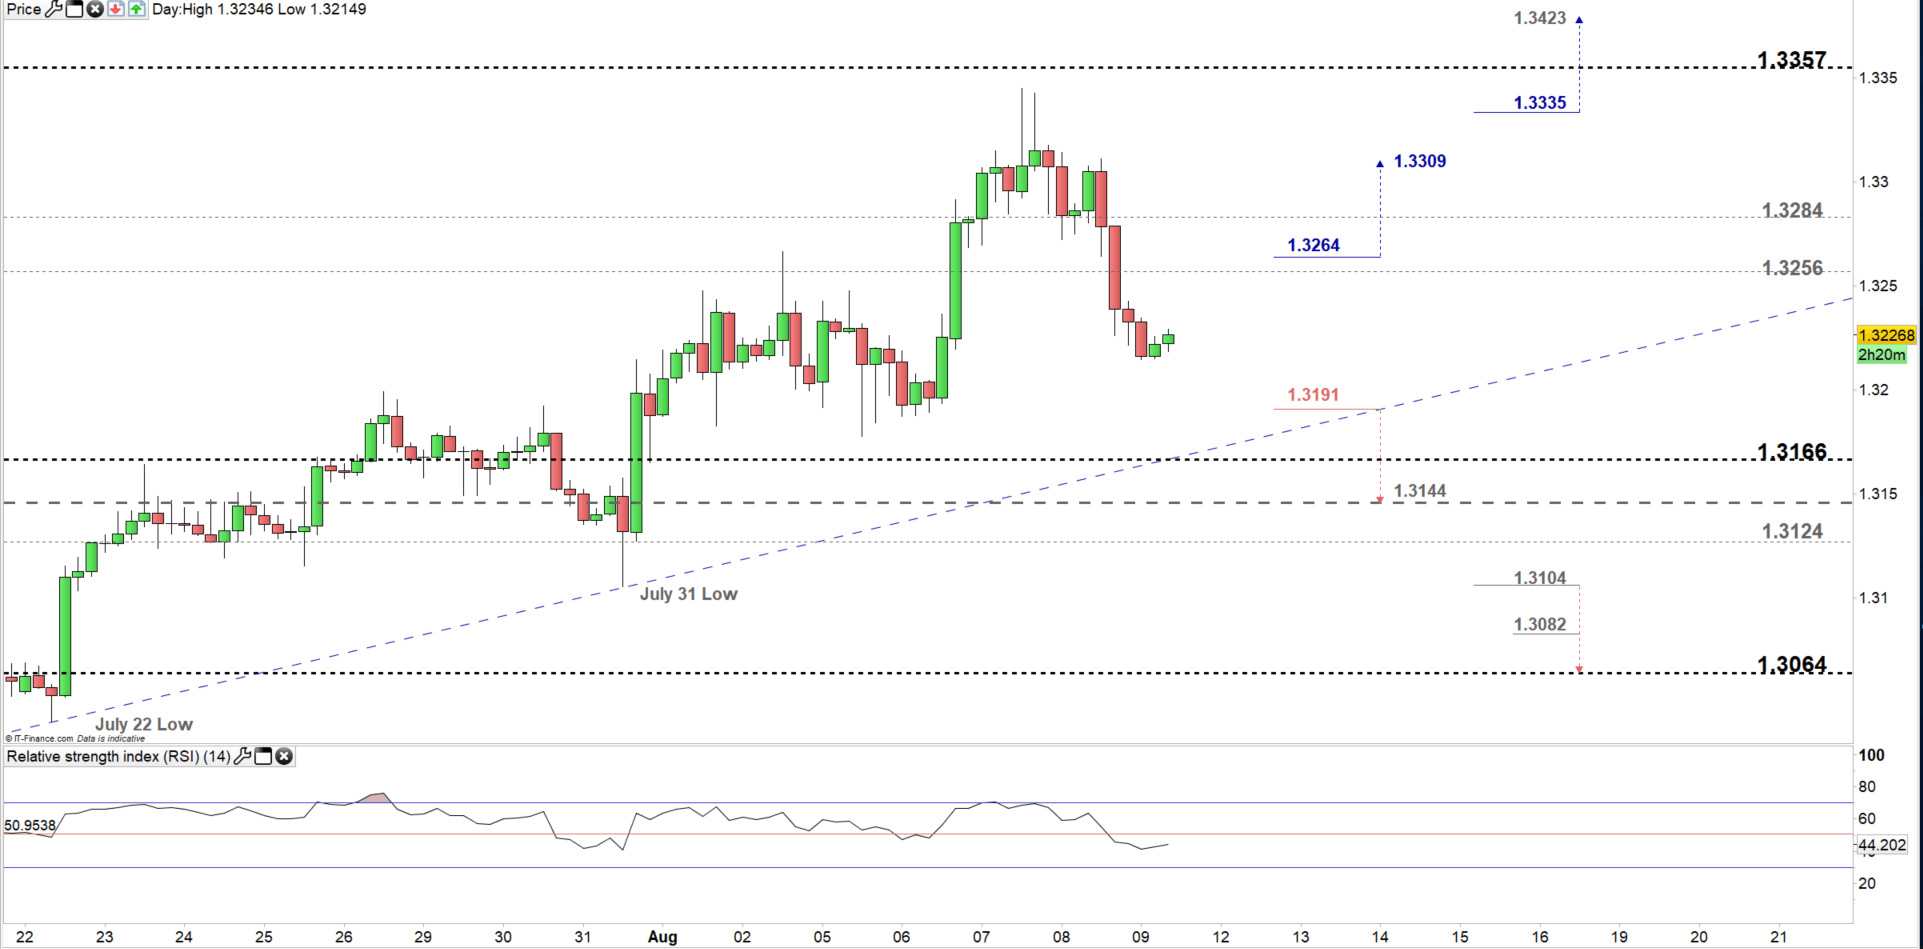
Looking at the four-hour chart, we notice yesterday USD/CAD corrected lower creating a lower high at 1.3311. Today, sellers may press for a test of 1.3200 handle.
Considering the uptrend line originated from the July 22 low at 1.3040, then a break below 1.3191 could send the price towards 1.3144. Although, the low end of the aforementioned trading zone needs to be monitored. See the chart to know more about the following weekly support levels sellers would face in a further bearish scenario.
On the flip-side, a break above 1.3264 may cause a rally towards 1.3309. However, the weekly resistance level at 1.3284 needs to be watched closely. See the chart to find out more about the following daily resistance levels buyers would encounter in a further bullish scenario.
Written By: Mahmoud Alkudsi
Please feel free to contact me on Twitter: @Malkudsi


