


USD/CAD Price Outlook, Charts and Analysis
Have you checked our latest trading guides for USD and Gold? Download for free Q3 Main Currencies and Commodities Forecasts
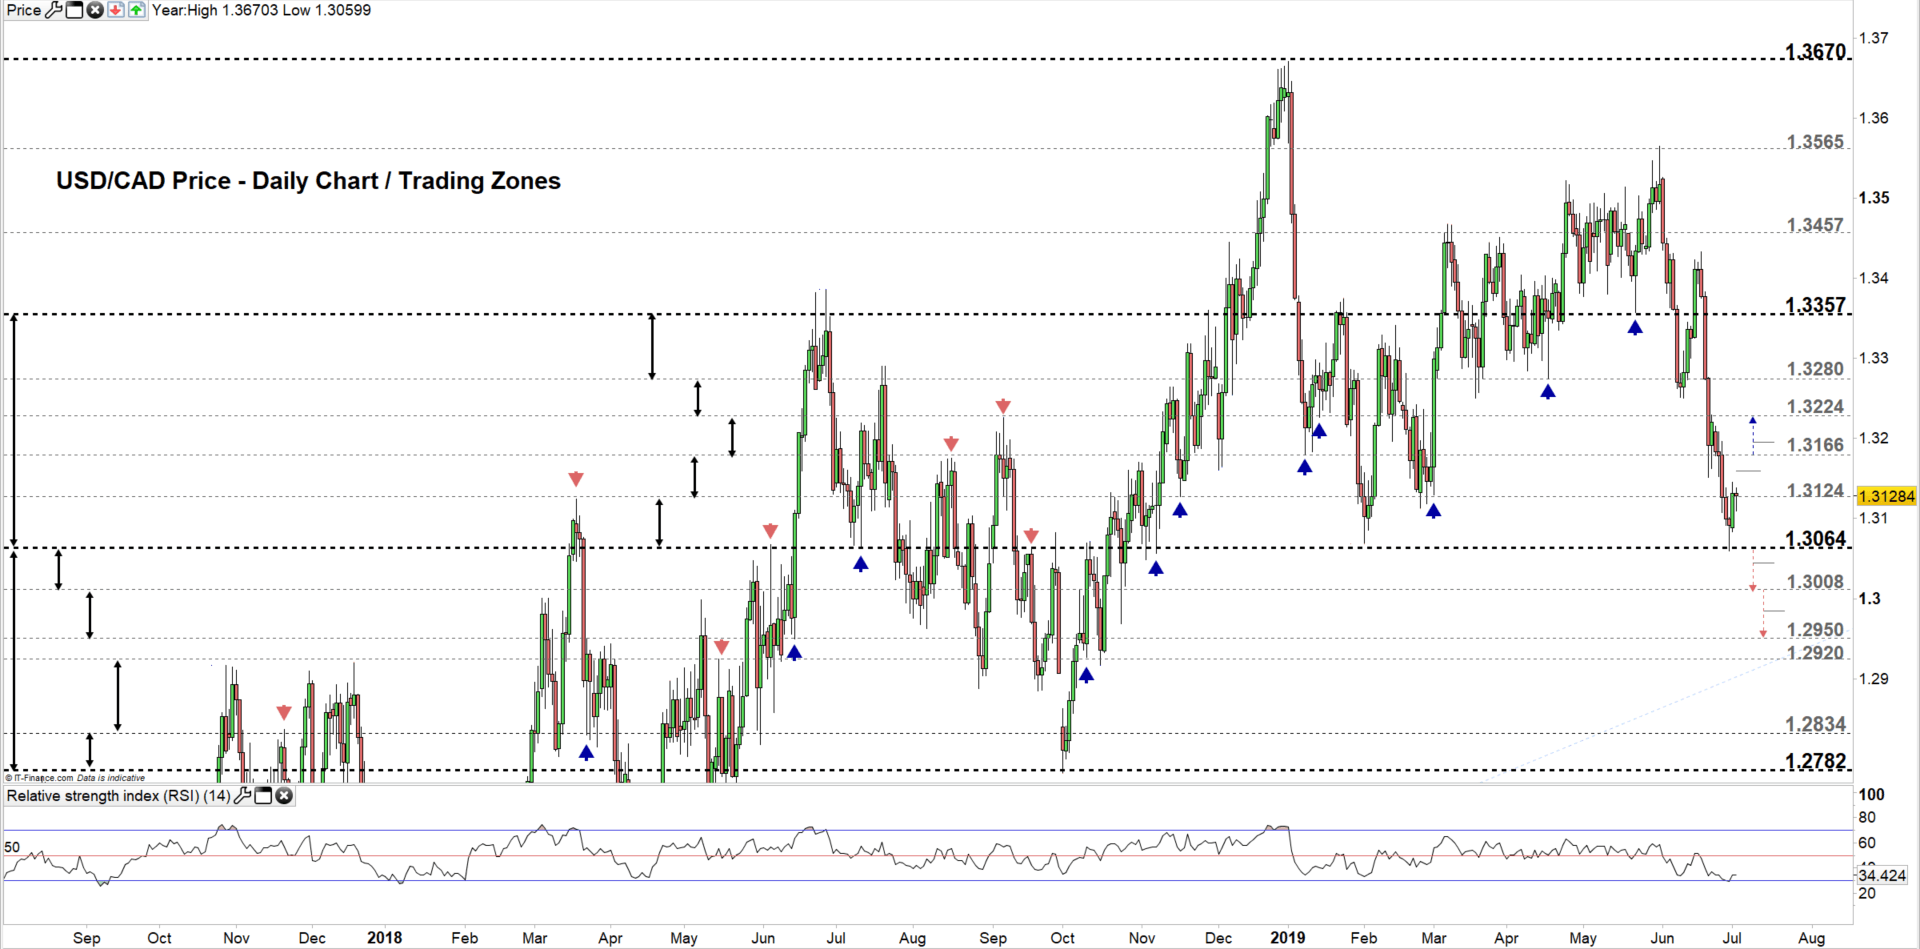
USD/CAD – Sellers Holding Fire
On June 28, USD/CAD broke below its yearly support discussed in our previous update at 1.3064 and printed its lowest level in over seven months and a half. The price rallied after with the sellers likely taking profits. The monthly candlestick closed with 3.1% loss at 1.3191.
Alongside, the Relative Strength Index (RSI) rebounded from the oversold territory, reflecting the lack of momentum to keep pushing the price lower.
Having trouble with your trading strategy? Here’s the #1 Mistake That Traders Make
USD/CAD DAILY PRICE CHART (Aug 4, 2017 – JUn 28, 2019) Zoomed Out
USD/CAD DAILY PRICE CHART (Mar 15, 2018 – JUL 2, 2019) Zoomed In
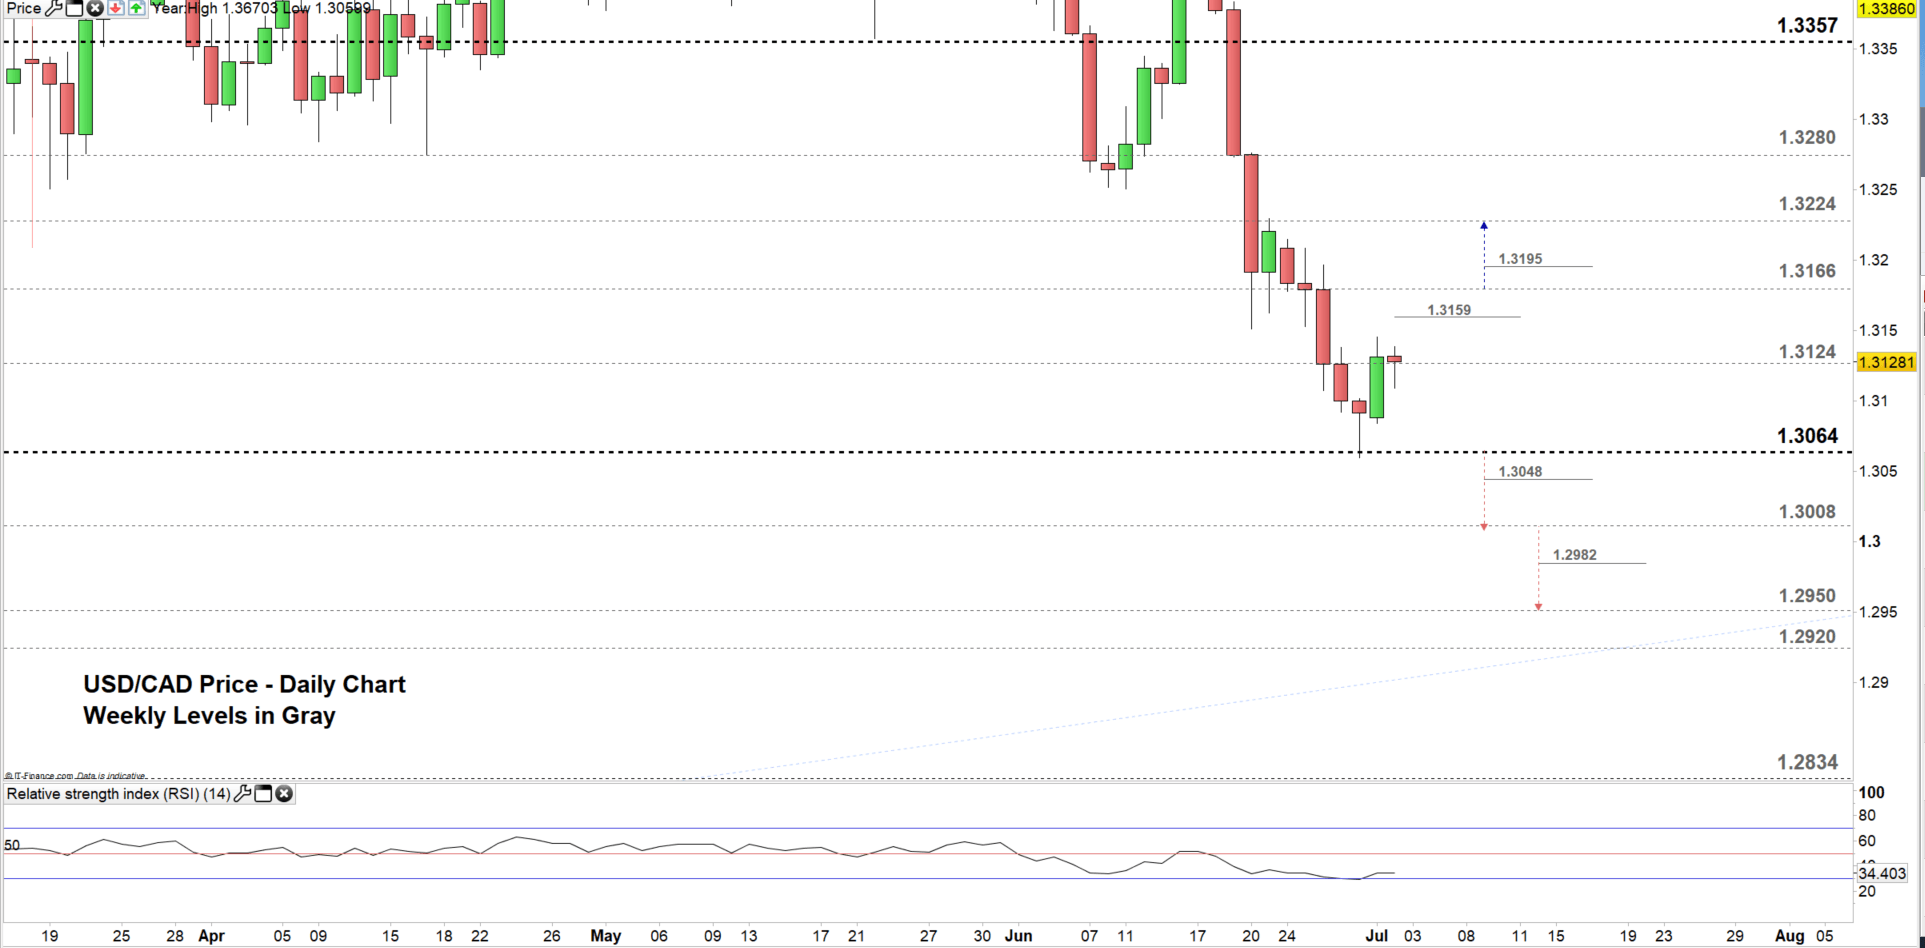
Looking at the daily chart we notice USD/CAD eyeing the high end of the current trading zone 1.3124 – 1.3166. Further close above the high end may cause the price to rally towards 1.3224, however; the weekly resistance levels highlighted on the daily chart (Zoomed in) need to be watched along the way.
In turn, a close below the low end of the aforementioned trading zone could send the price even lower to test the vicinity at 1.3064-60. Further close below these levels may cause the price to decline towards 1.3008, although; the weekly support levels marked on the chart should be considered.
Just getting started? See our Beginners’ Guide for FX traders
USD/CAD Four-HOUR PRICE CHART (May 22, 2019 – JuL 2, 2019)

Looking at the four-hour chart, we notice on Friday USD/CAD created a lower low at 1.3059. Yesterday, the price rallied and rebounded from 1.3145. Therefore, a break above this threshold may embolden the buyers to rally the price towards 1.3166. Although, the weekly resistance underlined on the chart needs to be kept in focus. See the chart for the key levels if the rally carries on beyond mentioned levels.
On the other hand, a break below the weekly support at 1.3048 may send the price even lower towards 1.3008 however, the daily support marked on the chart needs to be watched. See the chart for more details if the selloff continues below those levels.
Written By: Mahmoud Alkudsi
Please feel free to contact me on Twitter: @Malkudsi


