


USD/CAD Price Outlook
Canadian Dollar looking ahead to important data releases tomorrow, including retail sales.
USD/CAD Sideways pattern remains intact for now.
Download the Q2 USD and CAD forecast s to find out what is likely move the price through mid-year!
Learn more about USD and CAD data releases for this week from the DailyFX Economic Calendar
Just getting started? See our beginners’ guide for FX traders
USD/CAD Daily Price Chart (Feb 2019- May 21, 2019)
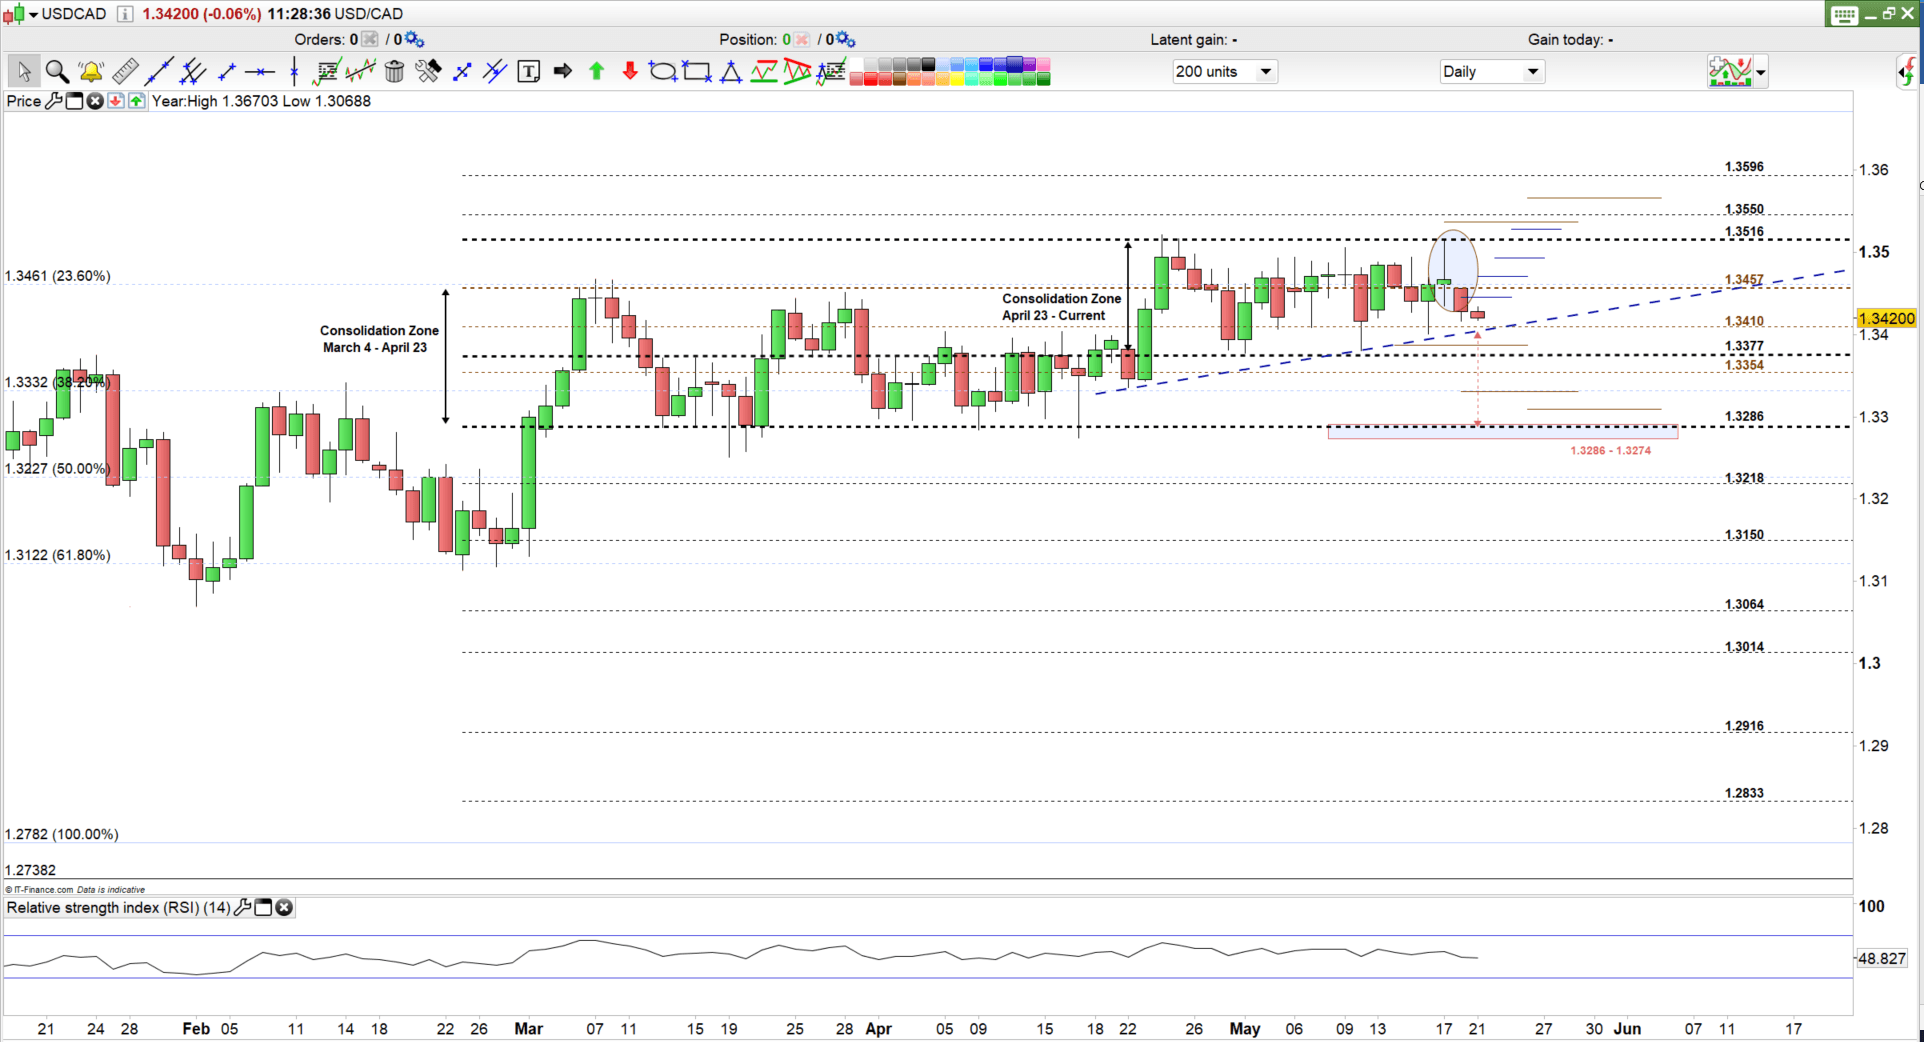
USD/CAD Stuck in a Sideways Pattern
For nearly four weeks USD/CAD has been consolidating within a narrow trading range (1.3377 – 1.3516) showing hesitation from both buyers and sellers in pushing the price in a specific direction. Since May 3 this range has tightened further with the pair unable to close below 1.3410 or above 1.3490.
On May 16 USD/CAD closed above 1.3457 to push higher in the following day eying the high end of the congestion area. The price printed 1.3513 - its highest level in nearly 4 weeks, pulling back in the same day and closing with a bearish Doji pattern on the chart.
Read more in: Eyeing a bullish break of resistance
At the start of this week the pair opened with a downside gap breaking below 1.3457 hinting to test the zone 1.3400 – 1.3410. A break below the uptrend line originated from April 22 low at 1.3335 would entice the pair to swing lower to test the next support zone 1.3380 – 1.3387.
Bottom line: A close below 1.3377 will be essential to start a bearish momentum and if this happens the pair would likely push lower hinting towards the zone (1.3274 – 1.3286) although support at 13354 and the zone (38.2% Fibonacci retracement at 1.3332 and weekly support at 1.3335) with traders needing to watch 1.3309 along the way.
A close above 1.3516 could start a bullish momentum, rallying towards 1.3596. However, a series of resistance levels at 1.3528, 1.3538, 1.3550, 1.3565 need be cleared first.
What if USD/CAD Closes Today Above 1.3457?
It means more of the same, with the pair eyeing to test the high end of the trading range at 1.3516. Resistance levels at 1.3470, 1.3493 are worth monitoring.
Having trouble with your trading strategy? Here’s the #1 mistake that traders make
USD/CAD 2 Hours Price Chart (May 21, 2019)

USD/CAD Bearish Potential Below 1.3400
Today the pair broke below the uptrend line originated from May 16 low at 1.3401, testing 1.3410 for the first time since May 16. If USD/CAD bearish movement is strong enough to break below 1.3400 then the next significant support is at 1.3387 and then 1.3377.
If USD/CAD pushes above its highest price today at 1.3434 it could rally towards 1.3447 – highest price yesterday taking into consideration resistance level at 1.3440.
Written By: Mahmoud Alkudsi
Please feel free to contact me on Twitter: @Malkudsi


