


Key Takeaways:
- USD/CAD technical strategy: 2016 closing support (1.2450) seen as new resistance
- CAD trades at weakest levels since August, broader resistance is seen at 1.2723
- Rates picture favoring USD strength showing it’s difficult to fight ST momentum
- IGCS Highlight: Increase in short exposure favors ST upside bias
Trading in the opening days of a quarter is worth any trader’s attention. USD/CAD is no different as price continues to trade counter to the strong trend established in May of this year, and only recently let up in mid-September.
At October’s first day of trading, the Canadian Dollar is now trading at a four-week low alongside the price drop of Crude Oil. Much like Crude Oil though, the trend tends to favor both CAD & Crude strength despite the recent pull-back. Canada got a definitive boost from a hawkish turn from the Bank of Canada, whom only recently said they would proceed cautiously with further rate hikes. The price of Oil similar turned higher rather aggressively on an upgraded demand outlook that helped support the global rebalancing view.
On Tuesday, BoC Deputy Governor Sylvian Leduc would be expected to add color to Poloz’s comments about how the BoC will proceed cautiously. Currently, USD/CAD is trading above the 55-DMA near 1.2450. On the chart below, the white line signifies the closing low of 2016. The highlighted range is the price range of the extreme day in May 2016. A price break above this zone with resistance near 1.2714 would argue for a much deeper setback for CAD bulls. A hold of this levelthat canbe confirmed with US Rate yields failing to push higher from here or Crude Oil failing to fall further would likely align with a resumption of CAD strength like we’ve seen from Mid-May to mid-September.
What will happen to the USD as other central banks begin normalization? Click here to see our latest forecasts and find out what trades are developing in this new environment!
Recent data from the Commitment of Traders shows that hedge funds and other leveraged funds have added to their long CAD positions. The net-long positions recently hit the highest levels in five years for the week ended Sept. 26. The market naturally is led by rate expectations, and a return of hawkish language will likely be needed for these new CAD bulls to be rewarded for joining the longer-term trend.
The key support that traders can watch to help validate whether USD/CAD downtrend is resuming would be a break below the August 29 high of 1.2559 and the September 29 high of 1.2532. Until price breaks and closes below this zone, it’s hard to fight the ST trend of a higher USD/CAD that is favored per IGCS.
LT Daily USD/CAD Chart: USD/CAD trading into strong pivotal zone between 1.24-1.27
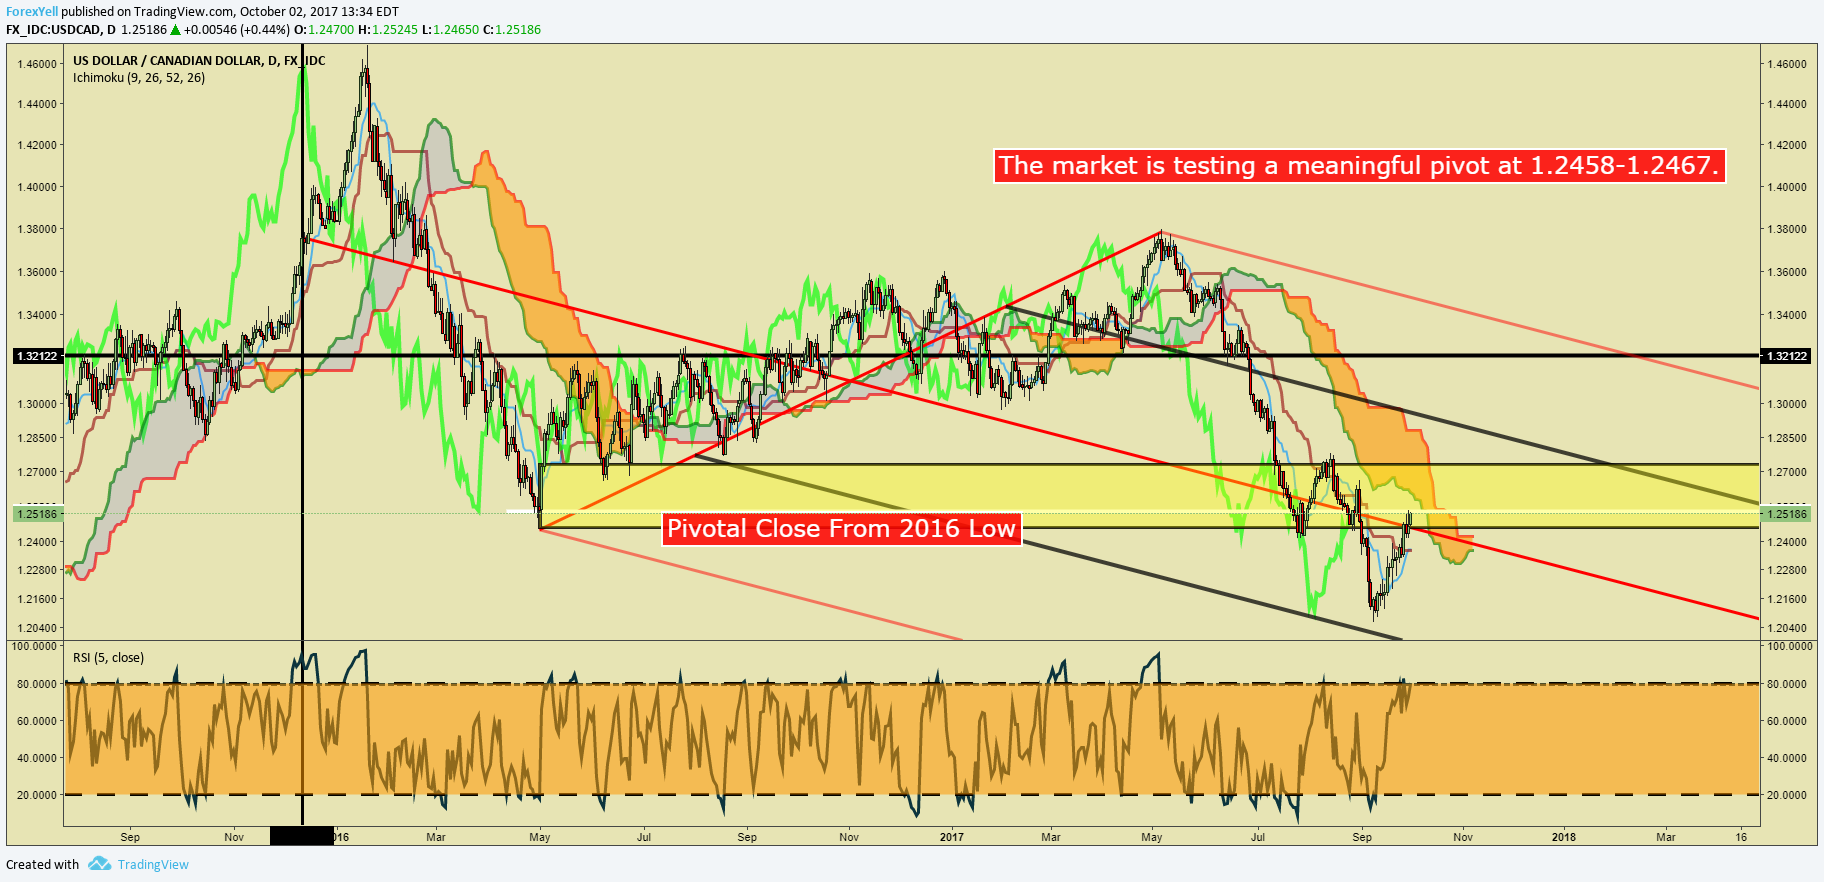
Chart Created by Tyler Yell, CMT
USD/CAD Insight from IG Client Positioning: Increase in short exposure favors ST upside bias
The sentiment highlight section is designed to help you see how DailyFX utilizes the insights derived from IG Client Sentiment, and how client positioning can lead to trade ideas. If you have any questions on this indicator, you are welcome to reach out to the author of this article with questions at tyell@dailyfx.com.
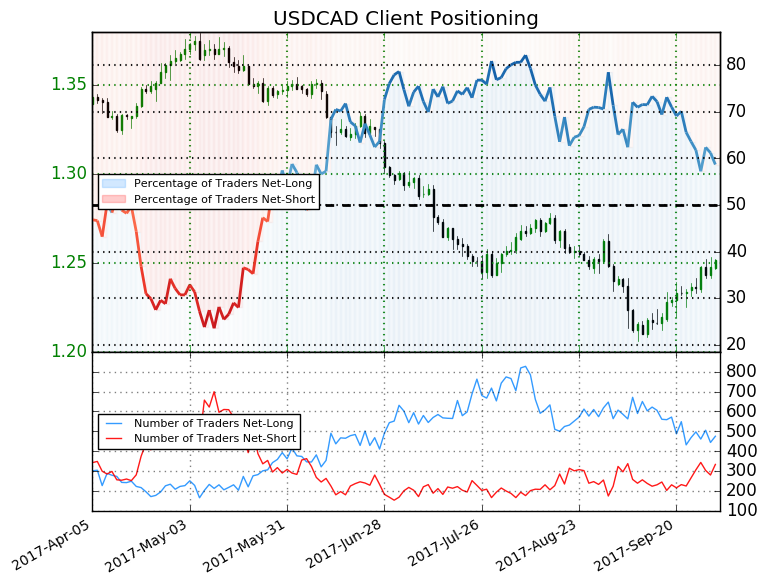
USDCAD: Retail trader data shows 58.7% of traders are net-long with the ratio of traders long to short at 1.42 to 1. In fact, traders have remained net-long since Jun 07 when USDCAD traded near 1.35087; theprice has moved 7.4% lower since then. The number of traders net-long is 2.6% higher than yesterday and 2.1% lower from last week, while the number of traders net-short is 10.9% higher than yesterday and 18.8% higher from last week.
We typically take a contrarian view to crowd sentiment, and the fact traders are net-long suggests USDCAD prices may continue to fall.Yet traders are less net-long than yesterday and compared with last week. Recent changes in sentiment warn that the current USDCAD price trend may soon reverse higher despite the fact traders remain net-long(emphasis added.)
---
Written by Tyler Yell, CMT, Currency Analyst & Trading Instructor for DailyFX.com


