


What will happen to the USD as other central banks begin normalization? Click here to see our latest forecasts and find out what trades are developing in this new environment!
Talking Points:
- USD/CAD technical strategy: USD/CAD halts near 61.8% retracement, looking lower
- Strong GDP encourages markets to watch for September BoC Hike
- IGCS Highlight: USD/CAD 34% decrease in weekly short exposure favors contrarian downside bias
The Canadian Dollar experienced a significant bout of strength on Thursday morning after a GDP print for 2Q got people talking. What they were talking about was that another BoC hike could come as soon as the September meeting after a 3.7% expected GDP print came in at 4.5%. This pace of growth in the Canadian Economy is the fastest since 2011.
Another component worth watching that had a +0.98 20-day rolling correlation coefficient, which signals the strength of the relationship, is a tightening between US and CA 2-year yields. You do not have to be well versed in fixed income/ sovereign bonds to see that the two-year yield on a country’s sovereign debt is often treated as a proxy for what the central bankers are expected to do from a monetary policy standpoint. Since May, we have seen the spread between US and CA 2-year yields go from 61 bps in favor of US yields to as tight as 3bps in late July, and after widening in mid-August, the yield spread is narrowing toward the 3bp mark. In other words, the Bank of Canada is expected to be neck-and-neck with the Federal Reserve looking 2-years into the future, but the trend of each central bank’s actions favor the Bank of Canada as being more hawkish and thereby leading the spread and possibly strengthen the CAD further.
Join Tyler at his Daily Closing Bell webinars at 3 pm ET to discuss key market developments.
The yield on the front end of the CA yield curve is one very helpful way of looking at the Canadian Dollar; the chart seems to show a significant resumption of the downtrend. Traders should keep an eye on support levels that were carved out in the last week of August. Namely, the August 29 low of 1.2550 to the August 25 low of 1.2440. A break and close below this zone would signal Canadian Dollar strength in a similar vein as was seen between May and July.
Only a break and close above the zone that includes the high traded at on Thursday morning before GDP at 1.2663, and the August 18 high of 1.2691 could we confidently say that the crises for USD/CAD bulls have been averted and that support may confidently be found in the 1.24/25 zone. You can see the resistance highlighted on the chart below, and you can see there is a battle in the works as to whether or not support will hold or the downtrend will resume.
240m USD/CAD Chart: Trendline from corrective highs may resistance further advances
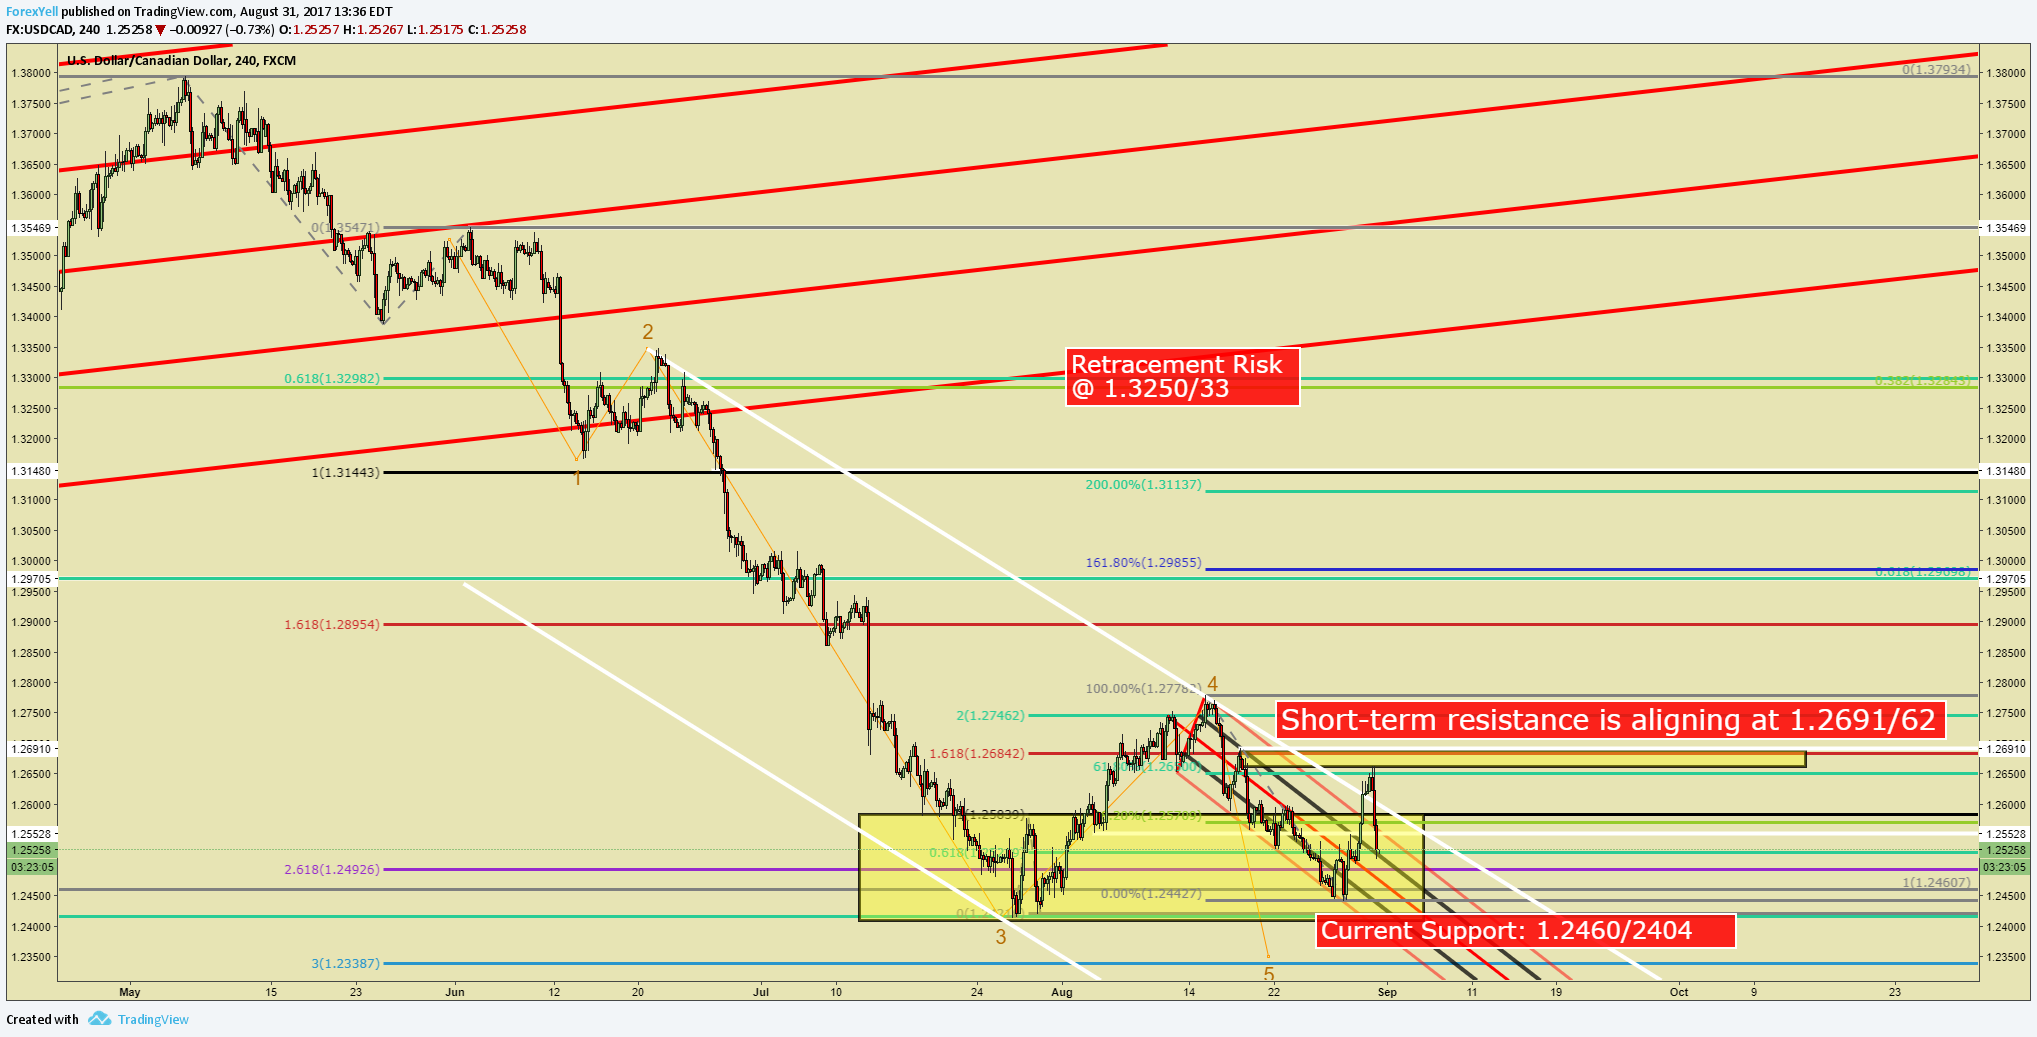
Chart Created by Tyler Yell, CMT
USD/CAD Insight from IG Client Positioning: 34% decrease in weekly short exposure favors contrarian downside bias
The sentiment highlight section is designed to help you see how DailyFX utilizes the insights derived from IG Client Sentiment, and how client positioning can lead to trade ideas. If you have any questions on this indicator, you are welcome to reach out to the author of this article with questions at tyell@dailyfx.com.

USDCAD: Retail trader data shows 76.0% of traders are net-long with the ratio of traders long to short at 3.16 to 1. In fact, traders have remained net-long since Jun 07 when USDCAD traded near 1.34832; price has moved 7.1% lower since then. The number of traders net-long is 10.8% lower than yesterday and 4.4% lower from last week, while the number of traders net-short is 9.5% lower than yesterday and 40.9% lower from last week.
We typically take a contrarian view to crowd sentiment, and the fact traders are net-long suggests USDCAD prices may continue to fall. Positioning is less net-long than yesterday but more net-long from last week. The combination of current sentiment and recent changes gives us a further mixed USDCAD trading bias.
---
Written by Tyler Yell, CMT, Currency Analyst & Trading Instructor for DailyFX.com
To receive Tyler's analysis directly via email, please SIGN UP HERE
Contact and discuss markets with Tyler on Twitter: @ForexYell


