


See How Live Clients Are Positioned in FX & Equities Here
Talking Points:
- USD/CAD Technical Strategy: One-Month Highs In CAD Turns Focus on May Low
- Trader Sentiment Warns a Coiled Move Lower Could Be Around the Corner
- USD/CAD Could Punch < 100-Week Moving Average on Renewed CAD Strength
Quick Fundamental Take:
The Canadian Dollar got a boost from May’s Employment Report that showed the Unemployment Rate dropped to 6.9%, the lowest since July thanks to full-time hires while adding 13,800 jobs. This print was well above the expected ~1,750 gain in jobs and continues to show that the Canadian Economy is likely weathering the drop, and subsequent rebound in Oil prices better than many expected.
Naturally, much attention has surrounded the potential number of rate hikes from the US Federal Reserve. As of Friday, June 10, the next priced in rate hike (above 50% probability) is in December. Given that we were pricing in a July hike a week ago, you can get a sense of the weakness in USD/CAD has the US Dollar continues to lose fundamental support. At this rate, it seems that a few years out, we could have more rate hikes from the Bank of Canada than the Federal Reserve.
Long-Term Technical Focus:
USD/CAD Has a Multitude of Strong Support at The 100-Week Moving Average
Interested In Learning the Traits of Successful Traders? If So, Click Here
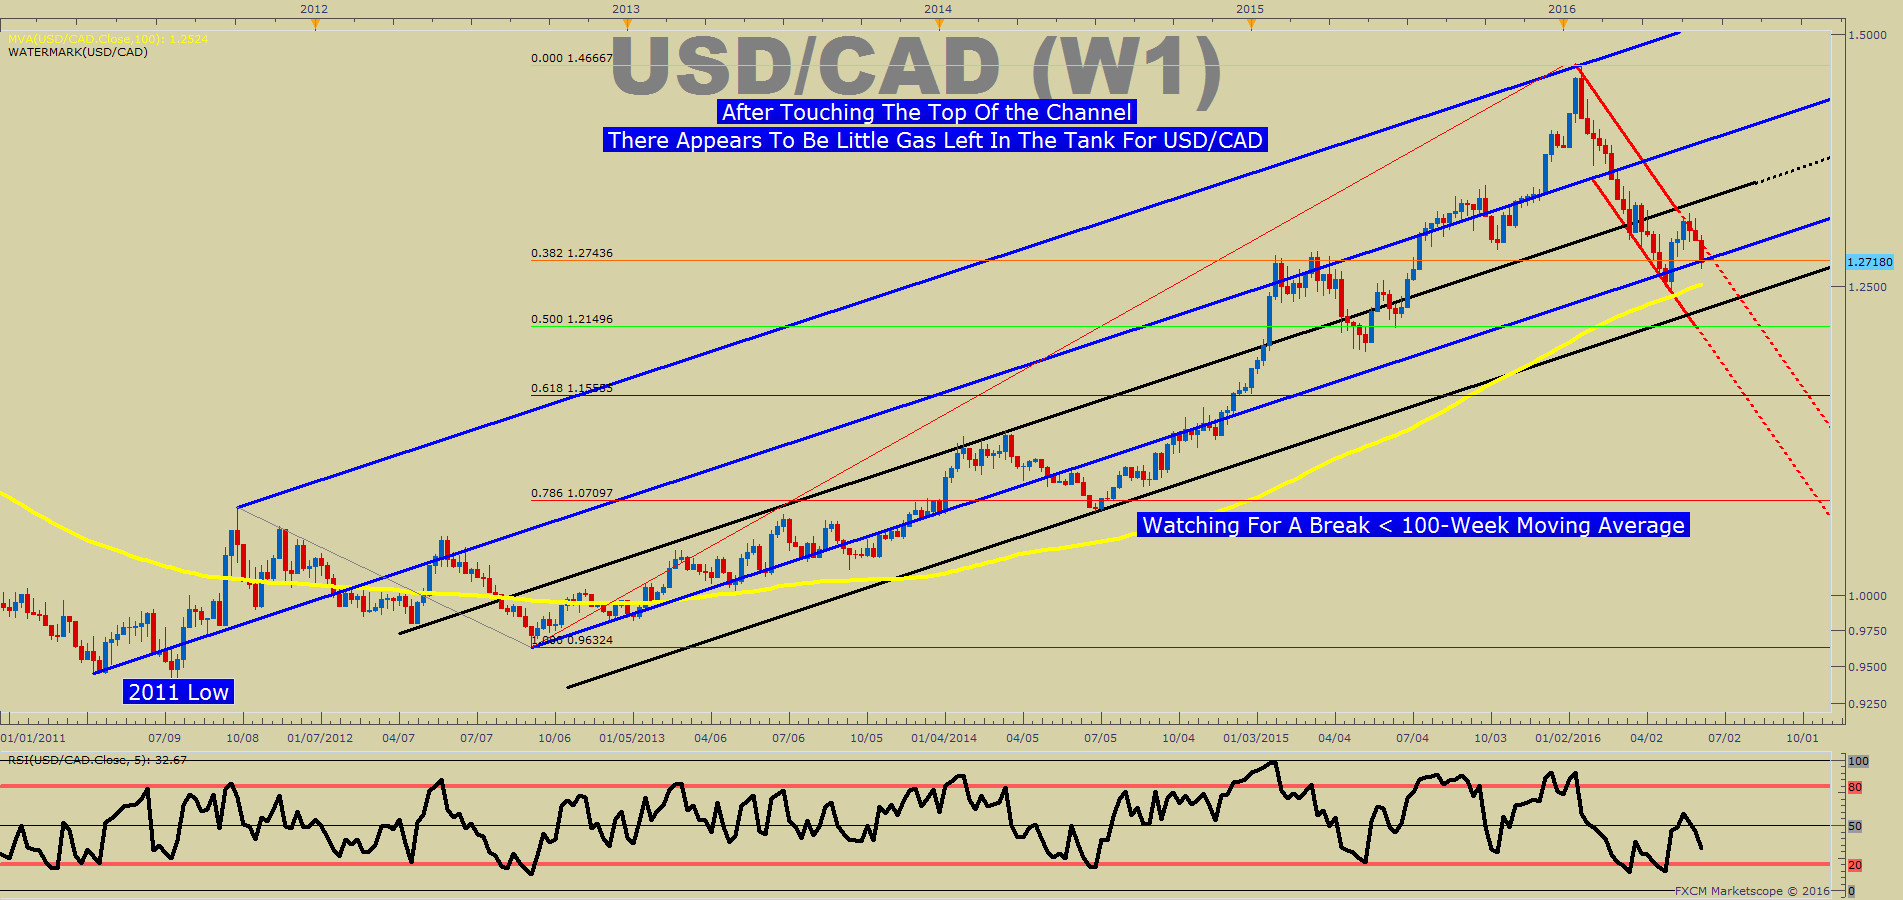
The decay of the USD/CAD Bull-Run has been a key theme of 2016. As you can see on the chart above, we are about to push below the 100-week moving average. Much of this has had the fundamental story explained above. However, you can see as well that the current retracement of 2016 has just pierced the Fibonacci 38.2% level. Another breakdown toward the 50 or 61.8% of the 2012-2016 range that could drop us down to ~1.2150 to 1.1585 respectively.
Either way, a break below the 100-WMA, currently at 1.2524 would be another dramatic showing in one of the markets strong forces of market reversion against a sentiment extreme (hat tip: Leon B.).
Short-Term Technical Focus: Key Support Levels from Here (Visual Map Below)

Going to a shorter-term chart than the one above, you can see we’ve had a lot of momentum build up to the downside on a 1-hour chart. When short-term trading, I find it helpful to add an Ichimoku Cloud on the chart and look for price & momentum to take place on one side of the cloud to confirm my directional bias for a trade. A break or disagreement is an indication I should wait as the market is picking a preferred direction for me to join.
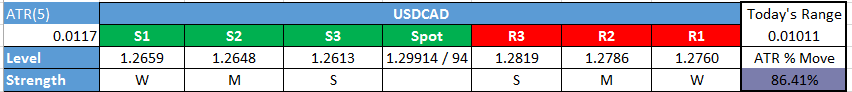
Added to the significance of the 1-hour Ichimoku Cloud is that a break above would occur around 1.2750. This level is the Weekly S2 Pivot, which when broken, is a strong inclination of a trend continuation. Therefore, resistance currently sits at 1.2750, and further resistance is at the late May low at 1.2908. A break above these two level could show another attempt at the mid-1.30s.
Looking lower from here, there is strong support at the May low of 1.2455 and the 100-WMA at 1.2524. Such a break would further show that there is little favoring bullish bets from a current technical standpoint.
Canadian Dollar Has Lost Favor per Sentiment
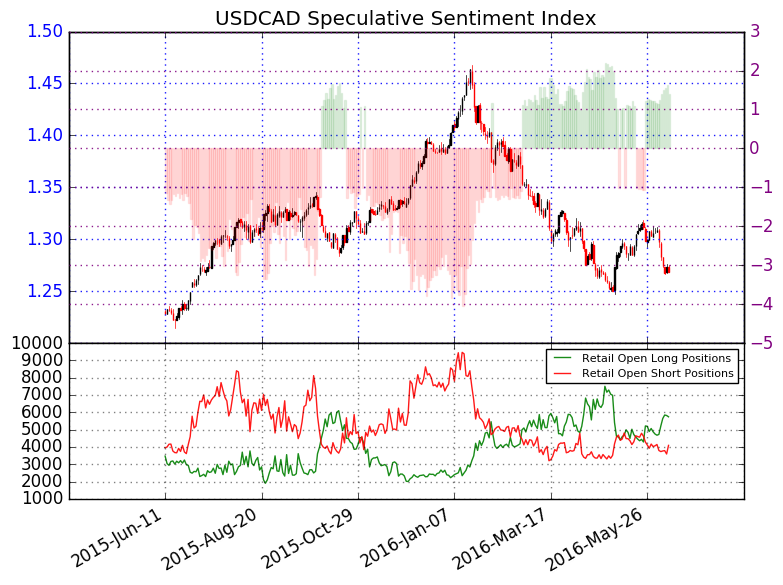
When looking at sentiment, crowd positioning has begun to favor further downside. For those familiar with our model, USD/CAD provided one of the strongest signals for downtrend continuation from late February to May. We use our Speculative Sentiment Index as a contrarian indicator to price action. Therefore, with that, the majority of traders increasing long exposure at a current ratio of 1.48 as 60% of traders are long; it’s worth being on the watch for further weakness.
Short positions are 5.7% lower than yesterday and 3.8% below levels seen last week. We use our SSI as a contrarian indicator to price action, and the fact that the majority of traders are long gives a signal that the USDCAD may continue lower. The trading crowd has flipped from net-short to net-long from yesterday and last week. The combination of current sentiment and recent changes gives a further bearish trading bias.
USD/CAD Speculative Sentiment Index as of Friday, June 10, 2016
Combining the technical picture above, with the sentiment picture, and the Intermarket analysis, there continues to be evidence for further CAD gains ahead against the US Dollar.
Key Levels as of Friday, June 10, 2016
T.Y.


