


See How FXCM’s Live Clients Are Positioned in FX & Equities Here
Talking Points:
- USD/CAD Technical Strategy: USD Weakness May Be Running Out of Steam, Wedge Breakout
- Trader Sentiment Warns A Trend Flip Could Be In The Cards
- USD/CAD Focus Turns to 34-DMA (1.2890) and Subsequent Price Action/ Fundamental Announcements
What a difference a few days make! On Tuesday morning, the US Dollar weakness train was rolling along and USD/CAD printed a fresh 10-month low (1.2459). Nearly 30 hours later, USD/CAD is higher by 3.4% or ~425 pips. This significant move at the beginning of May may be significant given the seasonal significance of May for the US Dollar.
Widest Trade Balance on Record for Canada
Understandably, many traders looked to the price of WTI Crude Oil to see if that explained the CAD weakness. While Oil has weakened on the session on renewed risk-off sentiment and a much larger than anticipated inventory build potentially implying less demand, the cause was altogether different. On Wednesday morning, Canada posted its widest ever trade deficit (Exports – Imports = Trade Balance) at –C$3.41.
Before we dive into the technical picture on USD/CAD, a few points should be made. Namely, the strength of the Canadian Dollar since January 20 could be showing real signs of a competitive disadvantage in the global market. Much focus has been placed on renewed demand in Emerging Markets to help with demand for resources, but other items like autos declined significantly as well. C$ has strengthened by over 15% in a little more than 90 days.
Interested In Learning the Traits of FXCM’s Successful Traders? If So, Click Here
While a stronger Canadian Dollar is understandably a burden on exporters, traders will likely wait for the Friday Employment Report to throw in the towel on the USD/CAD short position. Another component that would likely shake traders out of bearish USD/CAD tree would be Poloz noting the market needs to be realigned, which presumes no accord was made by central banks to back off currency weakening monetary policy.
USD/CAD (H4) Chart Shows A Trend That Continues To Hold Well Within A Bearish Channel

Key Support Levels from Here (Visual Map Below)
On the chart above, the reliable H4 Ichimoku cloud resistance has been broken and now the 34-DMA is under attack. The 425-pip move has likely taken short-term and trailing-stop short traders out of this move, which means there could be fuel to the ~13200 area.
Given the moon-shot nature of the move off Tuesday’s low of 1.2459, the main support between there and the ~425 pip move higher is today’s low of 1.2696. For now, those two support levels are worth watching and if neither is hit, we may have seen a sneaky low be put in for the CAD as the seasonably strong US Dollar returns to favor.
USD/CAD Bullish Wedge Is Breaking Out (H1 Chart)
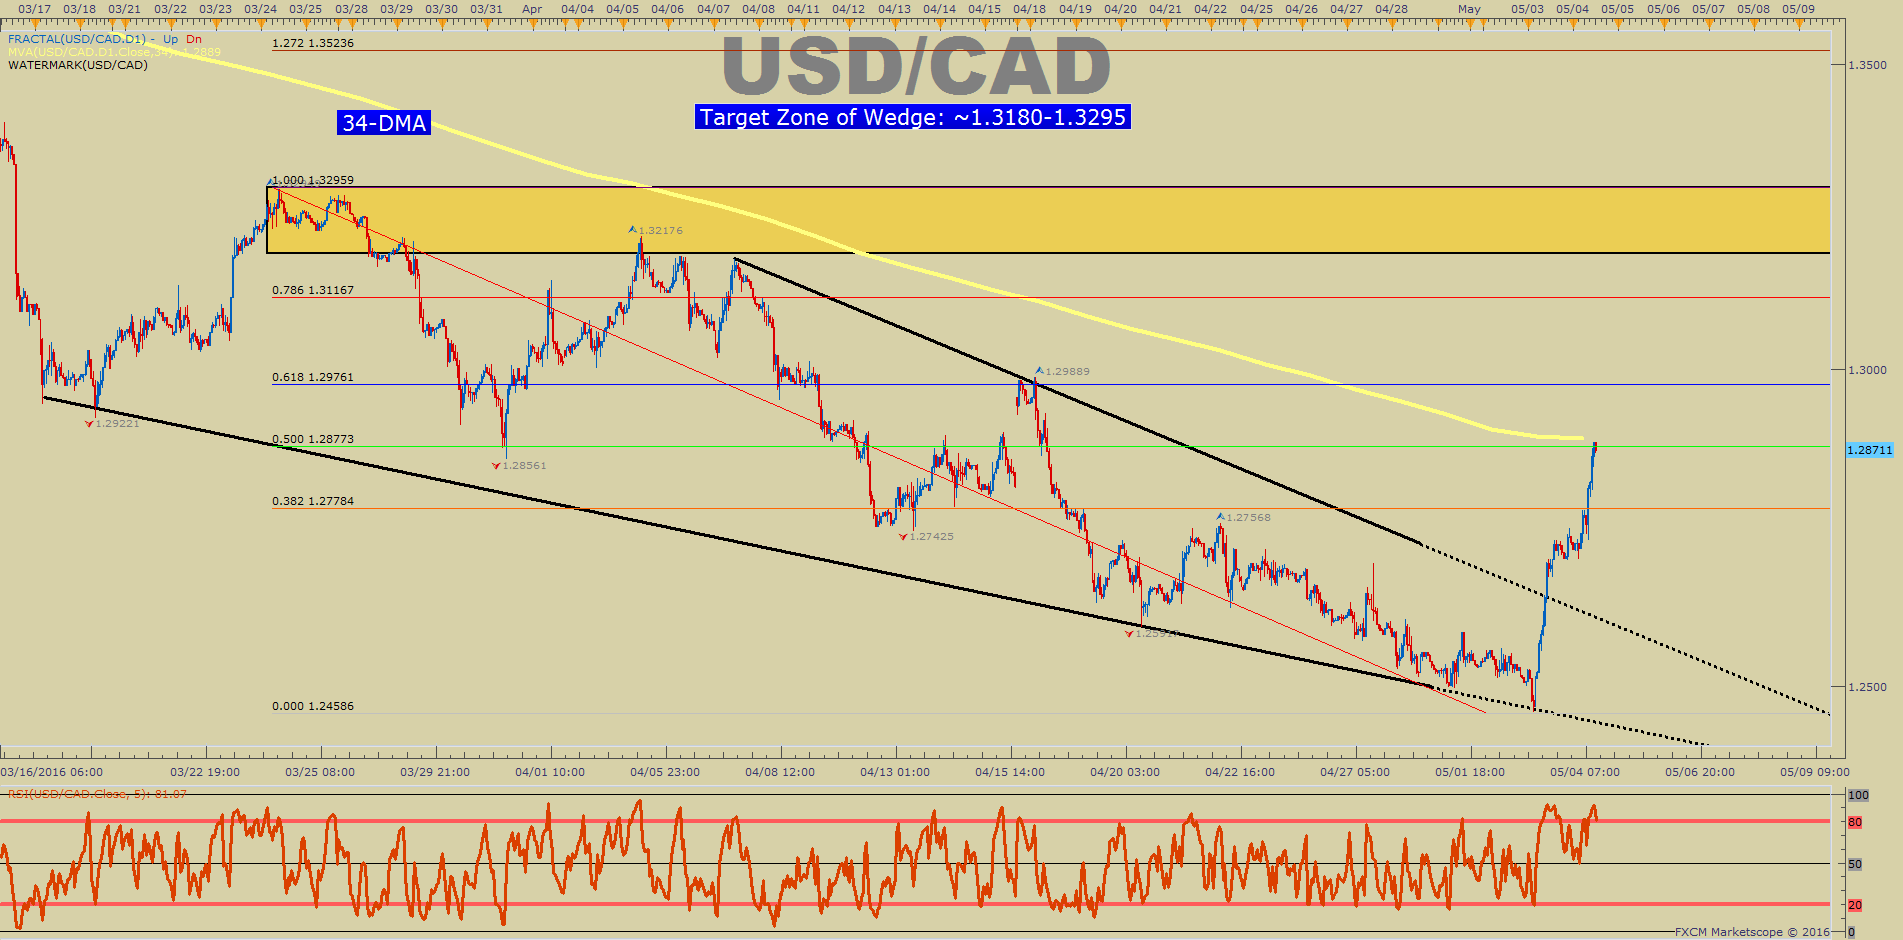
Regarding resistance, we recently broke above 1.2750, which was the top of the H4 Ichimoku Cloud and last week’s Pivot Point. As of Mid-Day Wednesday, the HoD is right at the 34-DMA, which has been solid resistance and currently sits at 1.2890. Beyond the 34-DMA lies the mid-April high of 1.2989, and the corrective top of a three-wave move that the wedge is drawn from that eventually led to an impulsive decline that we’re in right now, but may be exiting.
Canadian Dollar Rally Looks Steady per Sentiment
When looking at sentiment, crowd positioning has suddenly turned to long-term trend supporting. For those familiar with our model, this favors a larger move retracement may be under way. We use our Speculative Sentiment Index as a contrarian indicator to price action, and the fact that the majority of traders are net-flat at a bull: bear of -1.01 as 50% of traders are long means that the long-held bearish USD/CAD signal may be fading. The Bear signal is being most challenged since late January, and as you can see in the charts below, the downside may favor a move higher.
Yesterday the ratio was 1.37; 58% of open positions were long. Long positions are 14.6% lower than yesterday and 32.5% below levels seen last week. Short positions are 18.5% higher than yesterday and 40.7% above levels seen last week.
USD/CAD Speculative Sentiment Index as of 5/4/2016

Combining the technical picture above, with the sentiment picture, and the Intermarket analysis support further warns of more CAD gains ahead.
Key Levels as of Wednesday, May 4, 2016

Showcase your trading skills against your peers in FXCM's $10,000 Monthly Challenge with a Mini Account.
T.Y.


