To receive Tyler’s analysis directly via email, please SIGN UP HERE
Talking Points:
- USD/CAD Technical Strategy: Bearish Key Weekly Candle now Resistance
- Recent Break of Closing Price Trendline Turns Focus Lower
- Long-Term Divergence Favors Further Unwind, Watching 1.2868
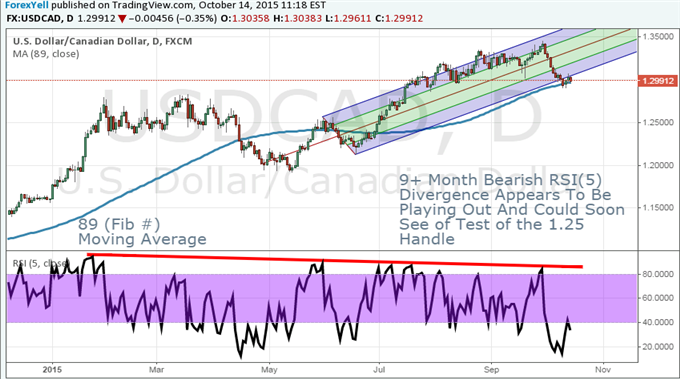
The recent break through resistance for US oil brought USDCAD to its lowest level since late July. Across the board, traders are focused on the US dollar as we sit on the 200-day moving average. Fundamental arguments could be made that Canada has leveraged exposure to the United States and therefore what's bad for the USD is bad for the CAD. However, the commodity currency strength and USD unwind of long positions are in focus now.
After we confirmed the Bearish key week by closing below 1.3175, we are now looking to sell strength strategically. This multiyear trend may be set for a deeper correction than many first anticipated. Right now we are sitting near the 38.2% retracement of the June to late September 1300 pip range. The specific level for the Fib Retracement is 1.2948 with the next level below in focus being the 50% retracement at 1.2791, which also aligns with the early 2015 highs.
Key support at 1.2950 eroded after the Bearish Key weekly candle printed. These multiple bearish developments bring doubt into the picture of the 100-day moving average (1.2908) and prior price support of 1.2860 /35 area holding as support. Short-term resistance sits at 1.3080, which may bring enough of a price pop to favor short exposure at a better risk to reward ratio. Because we are tracing out a potential topping pattern similar to that seen in early 2015, it is worth noting a similar move would take us down to around 1.2525. Therefore, it is worthwhile to be patient if you are a closet USD Bull to see if the large trend reverses or resumes.
SSI (a contrarian sentiment indicator) shows that long positions have now grown 13.0% higher than yesterday and 61.2% above levels seen last week, while new short orders continue collapsed. This could be further evidence that an aggressive turn is underway.Downside targets now sit around 1.2868-1.2505.
Add these technical levels directly to your charts with our Support/Resistance Wizard app!