


US Dollar Outlook:
- The US Dollar (via the DXY Index) has given up its gains after the release of the July FOMC meeting minutes.
- Directional biases are difficult to ascertain in both the DXY Index and USD/JPY rates as momentum indicators offer conflicting views.
- The IG Client Sentiment Index suggests that USD/JPY has a bullish bias in the near-term.

July FOMC Minutes Released
The highly anticipated release of the July FOMC meeting minutes proved to be a bit of a disappointment – at least for the US Dollar (via the DXY Index). The minutes contained no hawkish surprises, with one sentence standing out in particular: “Participants judged that, as the stance of monetary policy tightened further, it likely would become appropriate at some point to slow the pace of policy rate increases while assessing the effects of cumulative policy adjustments on economic activity and inflation.”
Recent data points suggest that recent Federal Reserve policy adjustments are indeed having the intended impact on aggregate demand and inflation: the US economy’s growth trajectory has slowed; and the July US inflation report showed a 0% m/m reading.
The knock-on effect of the July FOMC minutes was a slight reduction in rate expectations for the September Fed meeting. Odds of a 75-bps rate hike dropped from 51% yesterday to 46% today, suggesting that market participants are taking the latest communication from the Fed as confirmation of what was already known: the pace of rate hikes is due to slow over the coming months.
DXY PRICE INDEX TECHNICAL ANALYSIS: DailyTimeframe (August 2021 to August 2022) (CHART 1)

The gains accumulated by the DXY Index earlier today have since disappeared, with a second consecutive shooting star candlestick forming on the daily chart. The lack of follow-through to the upside may indicate that the recent rally above the descending trendline from the July high (yearly high) and the early-August swing high is failing, and a renewed drop below the uptrend from the late-March and late-May swing lows could transpire. Momentum indicators are conflicting at present time, meaning traders will likely have to wait for resolution around recent trendline breaks before a directional bias can be ascertained; more downside from here would increase the odds of a return towards the mid-June swing low at 103.42.

USD/JPY RATE TECHNICAL ANALYSIS: DAILY TIMEFRAME (August 2021 to August 2022) (CHART 2)
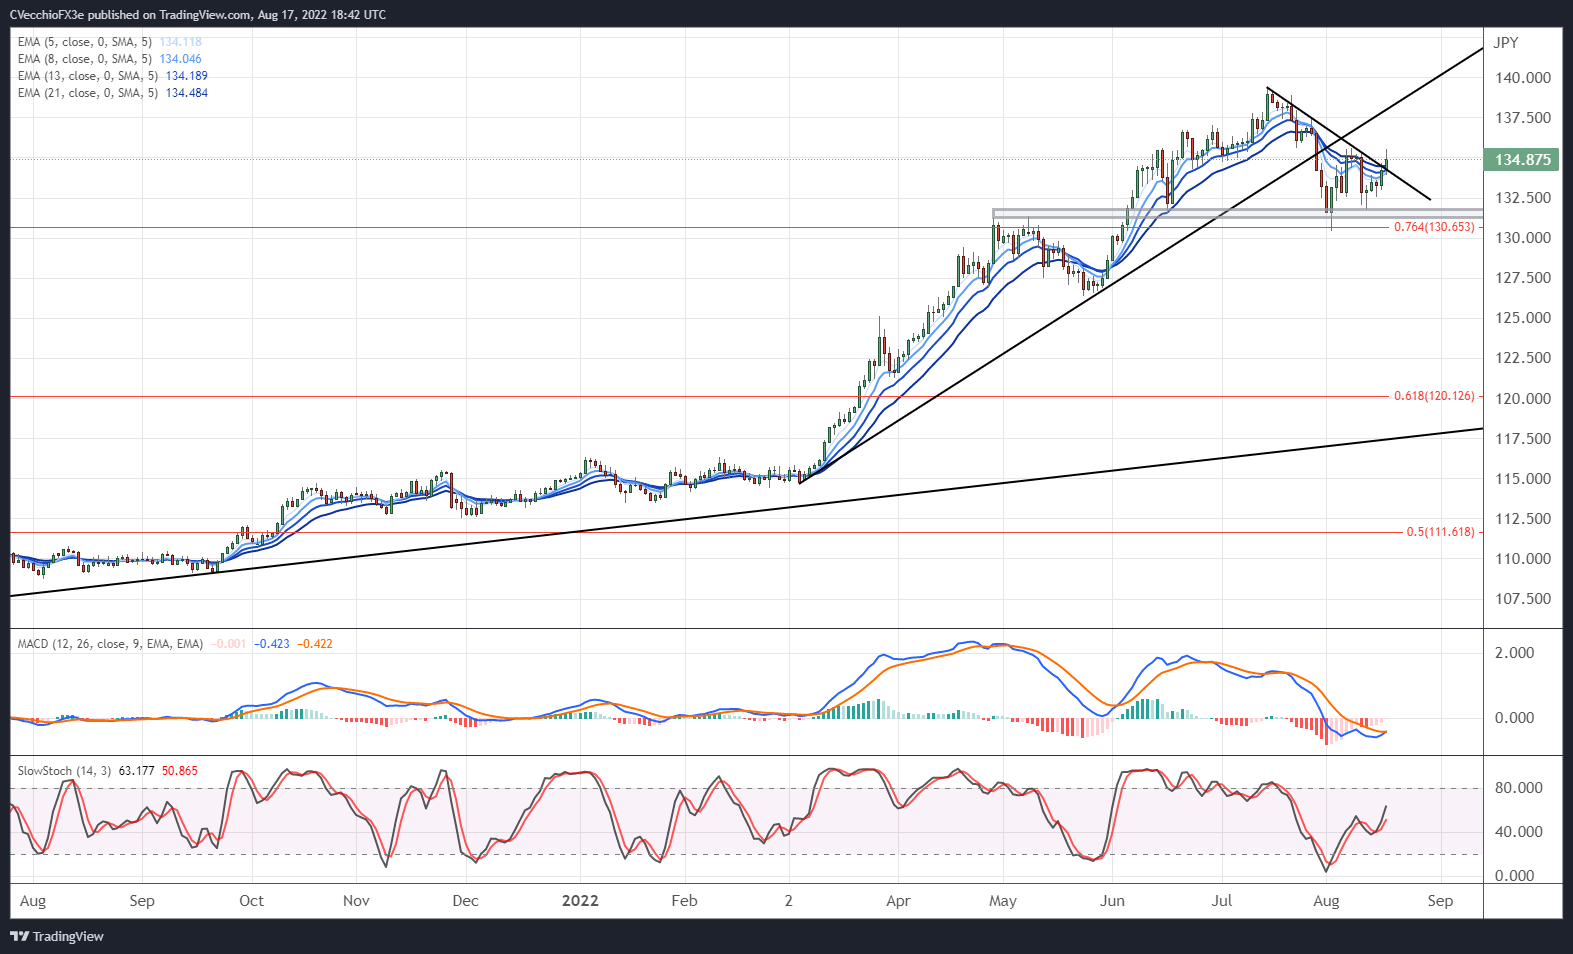
The rally by USD/JPY rates in recent days above the descending trendline from the July high (yearly high) and the early-August swing high is in question as traders sell the pair (as US Treasury yields soften) in the wake of the July FOMC minutes. A drop below the descending trendline could incite a return to the August low at 130.91, which was staved off last week. Like the broader DXY Index, momentum indicators are offering conflicting signals, suggesting more time is needed before a directional bias can be ascertained; range trading may ultimately prevail in the near-term if US Treasury yields pullback while US equity markets rally.
IG Client Sentiment Index: USD/JPY RATE Forecast (August 17, 2022) (Chart 3)
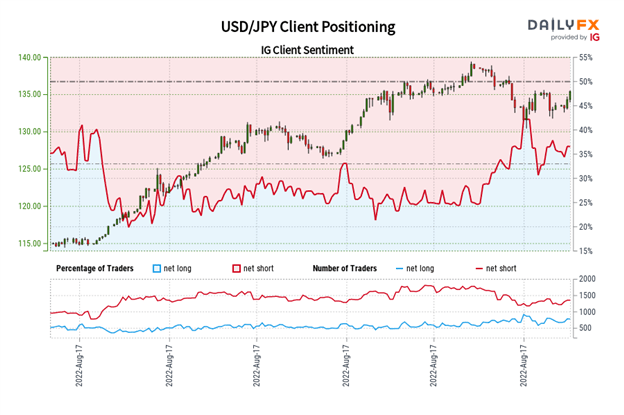
USD/JPY: Retail trader data shows 33.61% of traders are net-long with the ratio of traders short to long at 1.98 to 1. The number of traders net-long is 8.32% lower than yesterday and 2.94% lower from last week, while the number of traders net-short is 7.16% higher than yesterday and 21.08% higher from last week.
We typically take a contrarian view to crowd sentiment, and the fact traders are net-short suggests USD/JPY prices may continue to rise.
Traders are further net-short than yesterday and last week, and the combination of current sentiment and recent changes gives us a stronger USD/JPY-bullish contrarian trading bias.
Trade Smarter - Sign up for the DailyFX Newsletter
Receive timely and compelling market commentary from the DailyFX team
--- Written by Christopher Vecchio, CFA, Senior Strategist


