


US Dollar Outlook:
- The US Dollar (via the DXY Index) is plodding along near ascending triangle support.
- A rebound in risk appetite is sapping demand for the Japanese Yen; USD/JPY rates are at their highest level since November 26.
- The IG Client Sentiment Index suggests that USD/JPY has a mixed bias in the near-term.

US Dollar Holding Near Monthly Lows
The US Dollar (via the DXY Index) continues to give back last week’s gains as a rebound in risk appetite – spurred by relaxing concerns around the COVID-19 omicron variant – are allowing other currencies to claw back recent losses.
Two of the three largest components of the DXY Index, the British Pound (11.9% weight) and the Euro (57.6% weight), were among the more negatively impacted as omicron infection rates soared in late-November and early-December. Data suggesting that the new variant is less lethal is giving virus-burdened currencies a chance to shake off worries ahead of the holidays.
With various measures of Fed rate expectations remaining depressed from their yearly highs, as well as the general seasonal tendency for the US Dollar to slip into the end of the year, the DXY Index finds itself holding near its monthly lows, plodding along support in an ascending triangle that has been forming since early-November.
Slightly Less Hawkish Fed Anticipated
We can measure whether a Fed rate hike is being priced-in using Eurodollar contracts by examining the difference in borrowing costs for commercial banks over a specific time horizon in the future. Chart 2 below showcases the difference in borrowing costs – the spread – for the January 2022 and December 2023 contracts, in order to gauge where interest rates are headed by December 2023.
Eurodollar Futures Contract Spread (NOVEMBER 2021-DECEMBER 2023) [BLUE], US 2s5s10s Butterfly [ORANGE], DXY Index [RED]: Daily Timeframe (August 2021 to December 2021) (Chart1)
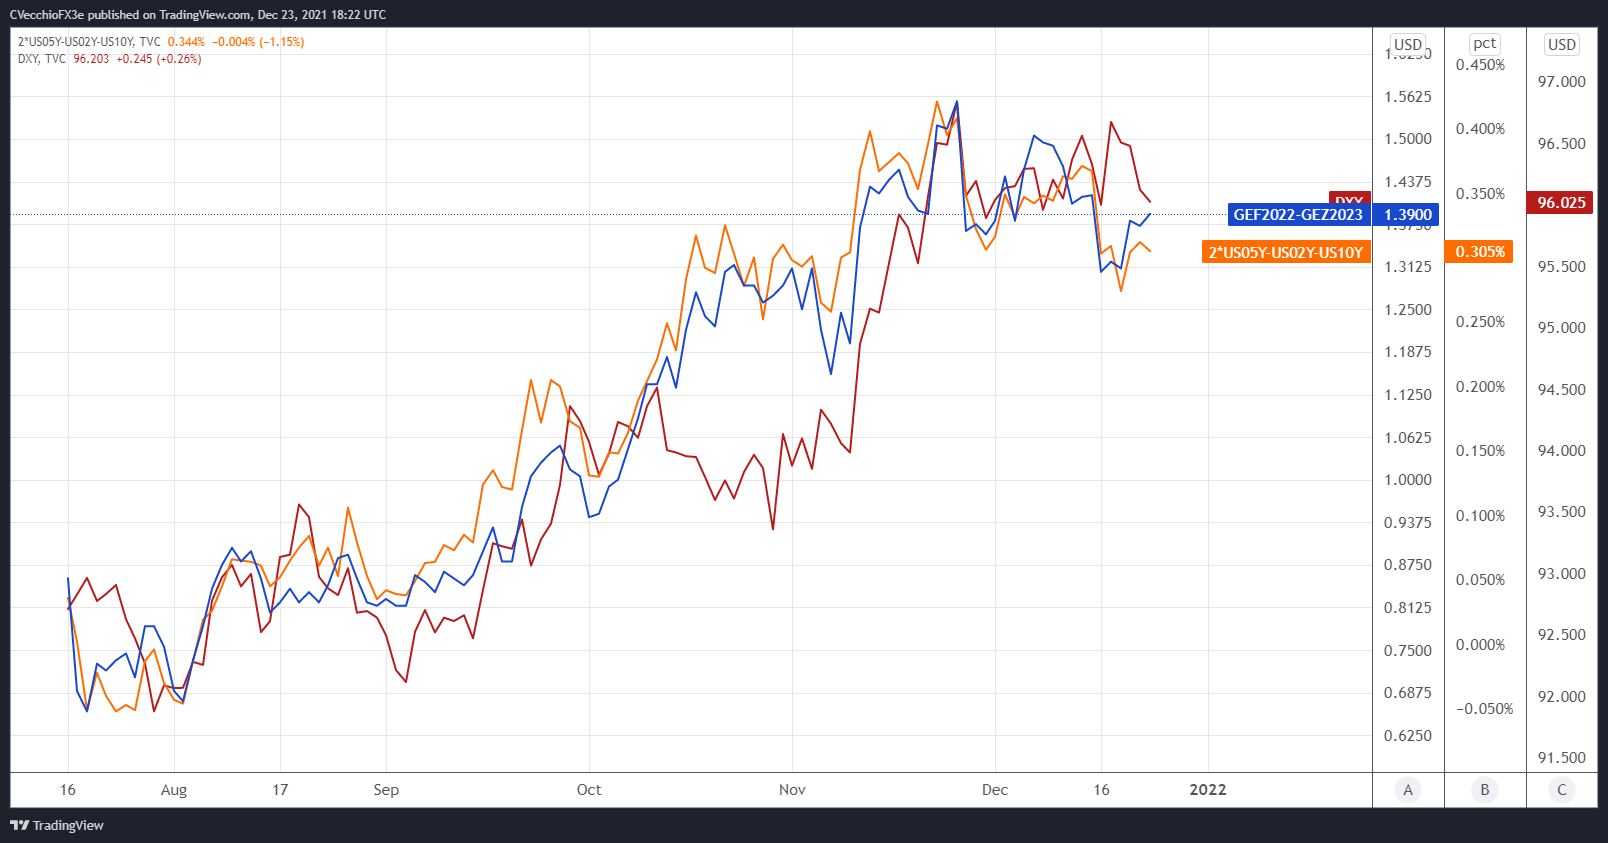
By comparing Fed rate hike odds with the US Treasury 2s5s10s butterfly, we can gauge whether or not the bond market is acting in a manner consistent with what occurred in 2013/2014 when the Fed signaled its intention to taper its QE program. The 2s5s10s butterfly measures non-parallel shifts in the US yield curve, and if history is accurate, this means that intermediate rates should rise faster than short-end or long-end rates.
There are 139-bps of rate hikes discounted through the end of 2023 while the 2s5s10s butterfly’s spread is now back at levels seen in early-November. In a sense, the market is suggesting that if the Fed is as aggressive in 2022 as it intends on being, then it may not be necessary to be so aggressive in 2023 with rate hikes as inflation cools; economic growth will be lower, too. Should these measures continue to contract from the highs seen in late-November, it would prove problematic for further US Dollar strength in the near-term.
DXY PRICE INDEX TECHNICAL ANALYSIS: DAILY Timeframe (September 2020 to December 2021) (CHART 2)

All of the DXY Index’ gains from last week have been erased, and the greenback gauge is now poised to secure two consecutive closes below its daily 21-EMA (the one-month moving average) for the first time since October 21 and 22. The DXY Index has faced difficult pushing higher through a confluence of Fibonacci levels: the 50% retracement of the 2017 high/2018 low range at 96.04; and the 23.6% retracement of the 2011 low/2017 high range at 96.48.
Ultimately, a consolidation of this nature – an ascending triangle – typically calls for a continuation effort higher. In context of the DXY Index’s preceding move, continuation would be the topside to fresh 12-month highs sometime in early-2022. But for now, with momentum turning bearish – daily MACD continues to point lower (albeit above its signal line) while daily Slow Stochastics have dropped below their median line – a loss of ascending triangle support could harken a deeper setback to the November 30 bearish outside engulfing bar low of 95.52.

USD/JPY RATE TECHNICAL ANALYSIS: WEEKLY TIMEFRAME (May 2015 to December 2021) (CHART 3)

While the DXY Index has struggled, the second largest component, the Japanese Yen (13.6% weight), hasn’t fared well at all as risk appetite surges; the US S&P 500 is on track for its highest close of the year – a new all-time closing high – ahead of Christmas. A look at the weekly timeframe suggests that USD/JPY’s sideways shuffle since October may soon be ending.
Bullish momentum is beginning to accelerate in USD/JPY rates. The pair is back above its weekly 4-, 8-, and 13-EMA envelope, which is in bullish sequential order. Weekly MACD has just issued a buy signal while above its signal line, and weekly Slow Stochastics have turned higher again while above their median line. A rally into the 61.8% Fibonacci retracement of the 2015 high/2016 low range at 115.52 – which coincided perfectly with the 2021 yearly high – appears likely to unfold in the coming weeks, even if the broader DXY Index trades lower.
IG Client Sentiment Index: USD/JPY RATE Forecast (December 23, 2021) (Chart 4)

USD/JPY: Retail trader data shows 32.86% of traders are net-long with the ratio of traders short to long at 2.04 to 1. The number of traders net-long is 2.91% higher than yesterday and 1.67% lower from last week, while the number of traders net-short is 0.64% lower than yesterday and 12.34% higher from last week.
We typically take a contrarian view to crowd sentiment, and the fact traders are net-short suggests USD/JPY prices may continue to rise.
Positioning is less net-short than yesterday but more net-short from last week. The combination of current sentiment and recent changes gives us a further mixed USD/JPY trading bias.

--- Written by Christopher Vecchio, CFA, Senior Strategist


