


US Dollar Outlook:
- The DXY Index is sustaining a move lower with its near-year long symmetrical triangle, following a failed bullish breakout attempt in July.
- USD/JPY rates, among the most sensitive USD-pairs to US Treasury yields, have been moving closer to multi-month lows.
- The IG Client Sentiment Index suggests that USD/JPY has a bullish bias in the near-term.

US Dollar Looks Sick
Historically speaking, the blend of lower US Treasury yields alongside reduced Fed rate hike odds has produced a problematic trading situation for the US Dollar. And that’s exactly where we find ourselves at the start of August: US Treasury yields are falling, and adjusted for inflation – US real yields – have dropped to record lows.
US Treasury Yield Curve (1-year to 30-years) (February 2020 to August 2021) (Chart 1)

With the July US nonfarm payrolls report due on this Friday, there may be more pain on the horizon for the greenback. While the delta variant headlines constitute a ‘wall of worry’ for financial markets, the 2Q’21 US GDP report last week, as well as the PMI readings at the start of August, suggest that the US economy’s recovery is losing steam in the short-term.
Sprinkle in fears of a negative US fiscal impulse in the coming months as the federal government’s stimulus efforts fade, and the US Dollar is losing its edge as a ‘growth’ currency amidst the coronavirus pandemic.
DXY PRICE INDEX TECHNICAL ANALYSIS: DAILY CHART (August 2020 to August 2021) (CHART 2)

The DXY Index’s bullish breakout failed at the end of July, producing a return back into the symmetrical triangle that has encompassed price action since September 2020. For now, the DXY Index is finding a pause at a familiar juncture, the dual Fibonacci retracements that reside at 91.93 (the 23.6% retracement of the 2017 high/2018 low range and the 38.2% retracement of the 2011 low/2017 high range).
The broad US Dollar gauge has seen momentum deteriorate in a significant manner in recent days. The DXY Index isbelow its daily 5-, 8-, 13-, and 21-EMA envelope, which is in bearish sequential order. Daily Slow Stochastics have dropped back into oversold territory, while daily MACD is trending lower, on approach to its signal line. Further losses towards the late-June swing levels near 91.60 can’t be ruled out this week.

USD/JPY RATE TECHNICAL ANALYSIS: DAILY CHART (December 2020 to August 2021) (CHART 3)
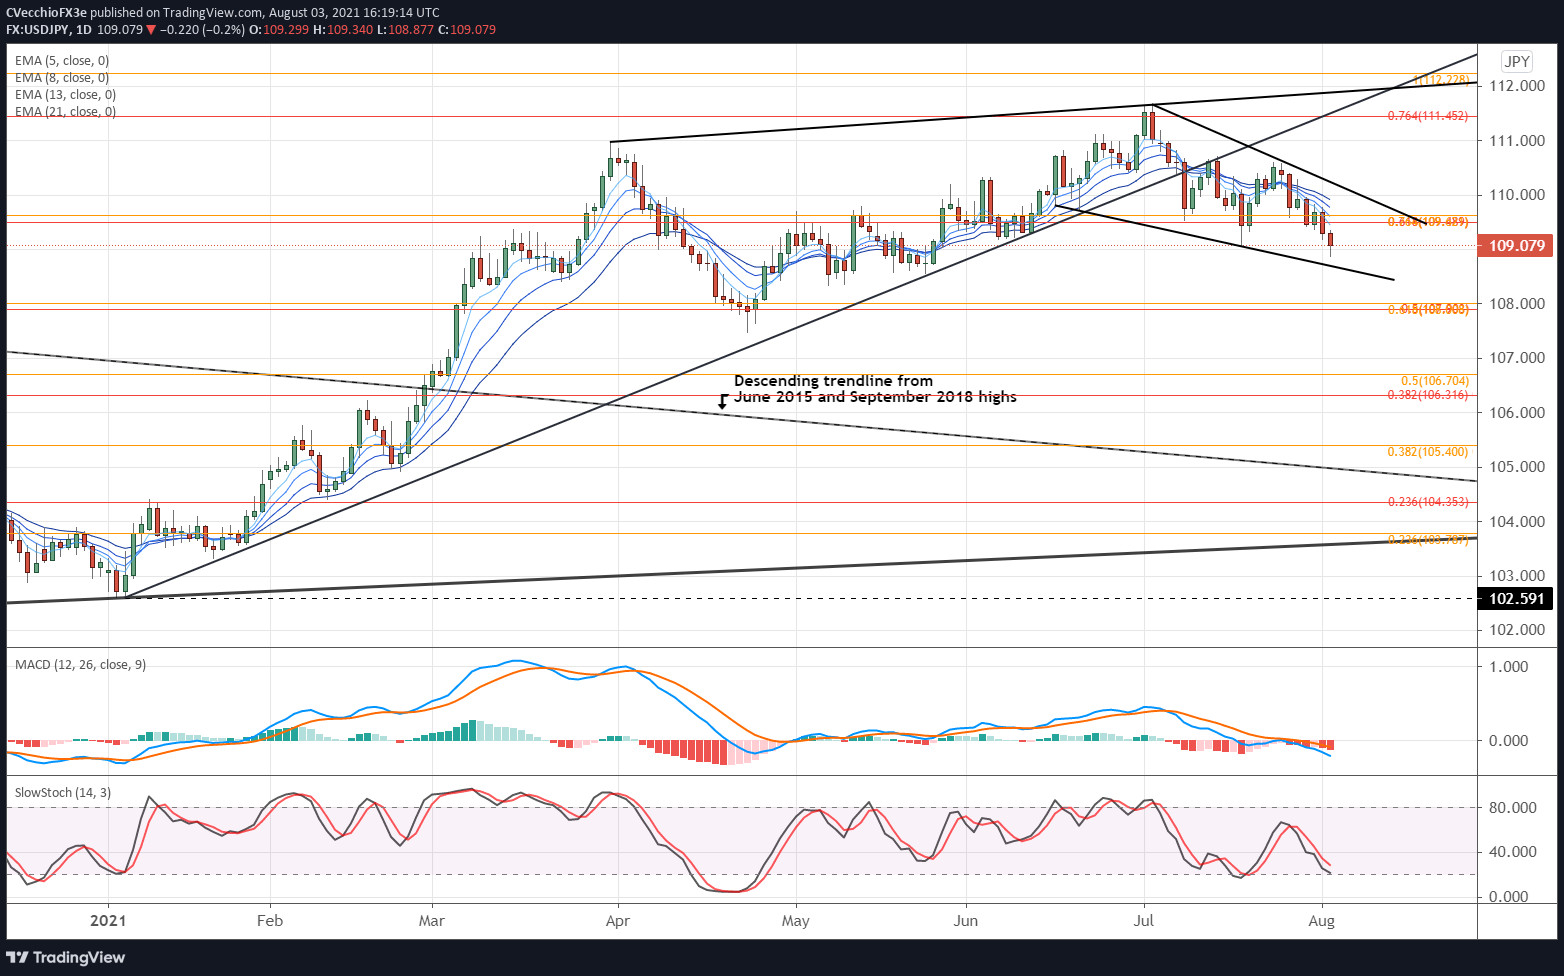
Consistent with the move lower by the DXY Index, the drop in US Treasury yields has produced unfavorable conditions for USD/JPY rates. In fact, today produced a move below both the June and July lows, suggesting that the series of ‘higher highs and higher lows’ that defined price action for much of 2021 – in fact, into the first week of July – is now finished.
Momentum is souring quickly. USD/JPY rates are below their daily EMA envelope, which is in bearish sequential order. Daily MACD is extending its push below its signal line, while daily Slow Stochastics are quickly approaching oversold territory. The pair may be in the early stages of a new bearish trend.
IG Client Sentiment Index: USD/JPY RATE Forecast (August 3, 2021) (Chart 4)

USD/JPY: Retail trader data shows 56.06% of traders are net-long with the ratio of traders long to short at 1.28 to 1. The number of traders net-long is 14.43% higher than yesterday and 37.35% higher from last week, while the number of traders net-short is 7.58% lower than yesterday and 18.93% lower from last week.
We typically take a contrarian view to crowd sentiment, and the fact traders are net-long suggests USD/JPY prices may continue to fall.
Traders are further net-long than yesterday and last week, and the combination of current sentiment and recent changes gives us a stronger USD/JPY-bearish contrarian trading bias.

--- Written by Christopher Vecchio, CFA, Senior Currency Strategist


