


US Dollar Forecast Overview:
- The US Dollar (via the DXY Index) has broken a near two-month long downtrend, but the timing of the technical development warrants caution.
- The bounce may be traders simply covering their positions, not necessarily expressing a new, bullish view on the US Dollar.
- Retail trader positioning sees the potential for a short-term rebound in the US Dollar versus the Japanese Yen.
US Dollar’s Holiday Cheer
The US Dollar (via the DXY Index) is back to its highest level in a week, and with US equity markets dropping back, it appears that the US fiscal stimulus has turned out to be a ‘buy the rumor, sell the news’ type of event. US Dollar weakness over the past near two-months has front-run the shift to even larger fiscal deficits, and a run of weakness throughout 2020 portends to a period of profit taking at the end of the year – even if monthly seasonality trends have held up thus far.
Indeed, the US Dollar (via the DXY Index) has broken a near two-month long downtrend, but the timing of the technical development warrants caution. The break of the November to December downtrend would suggest that a near-term bullish reversal may gather pace. But the calendar – right before the holidays, following a year of prolonged weakness – suggests that the bounce may be traders simply covering their positions, not necessarily expressing a new, bullish view on the US Dollar.

DXY PRICE INDEX TECHNICAL ANALYSIS: DAILY CHART (December 2019 to December 2020) (CHART 1)
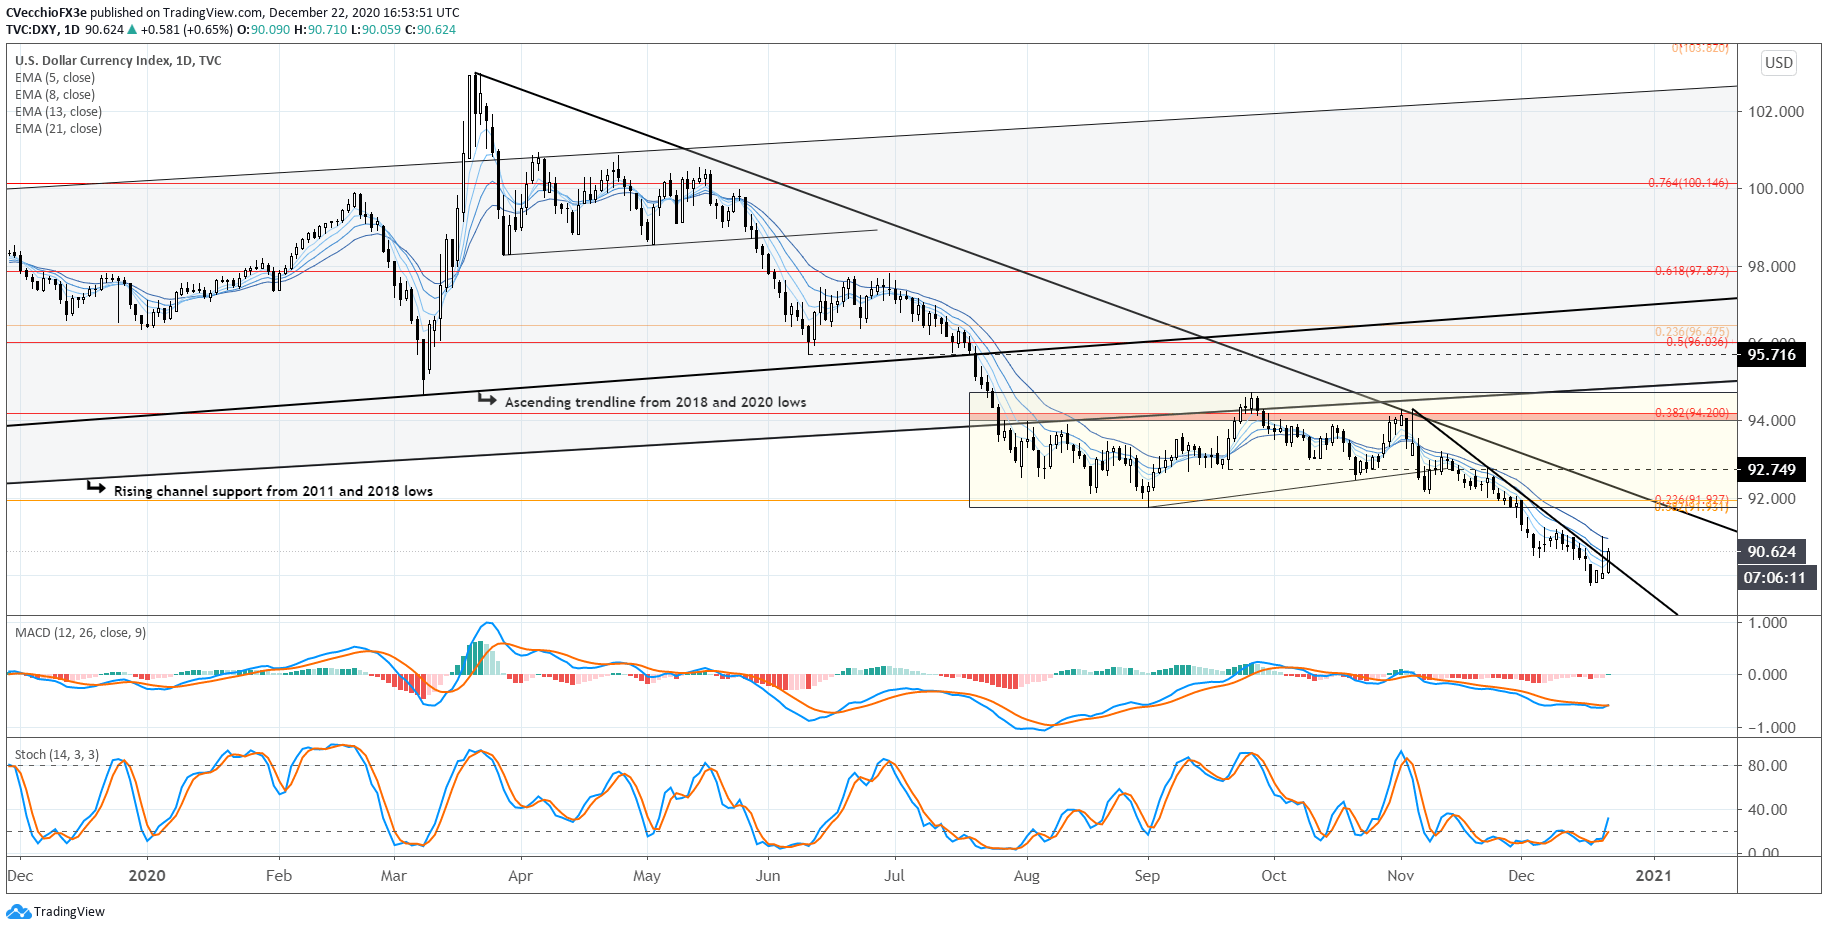
Accordingly, with liquidity thinning out around the holidays, near-term technical developments are less reliable and carry less weight than their longer-term counterparts. The DXY Index is threatening to break the daily 5-, 8-, 13-, and 21-EMA envelope, which is in bearish sequential order. Daily MACD is trending higher, but still below its signal line, while daily Slow Stochastics are just starting to perk up out of oversold territory. If anything, prior technicals pointing to a simple doubling of the range following the loss of 91.75 – calling for the DXY Index falling as far as 88.75 – may no longer be the prevailing narrative.
We thus view the latest development with hesitation, particularly when viewed in context of the longer-term technical damage wrought in recent months; the DXY Index remains below its multi-year uptrend, and could be working on a multi-year double top. So long as the rebound remains below 91.75, the DXY Index outlook remains bearish on a longer-term basis.

USD/JPY INDEX TECHNICAL ANALYSIS: DAILY CHART (December 2019 to December 2020) (CHART 2)
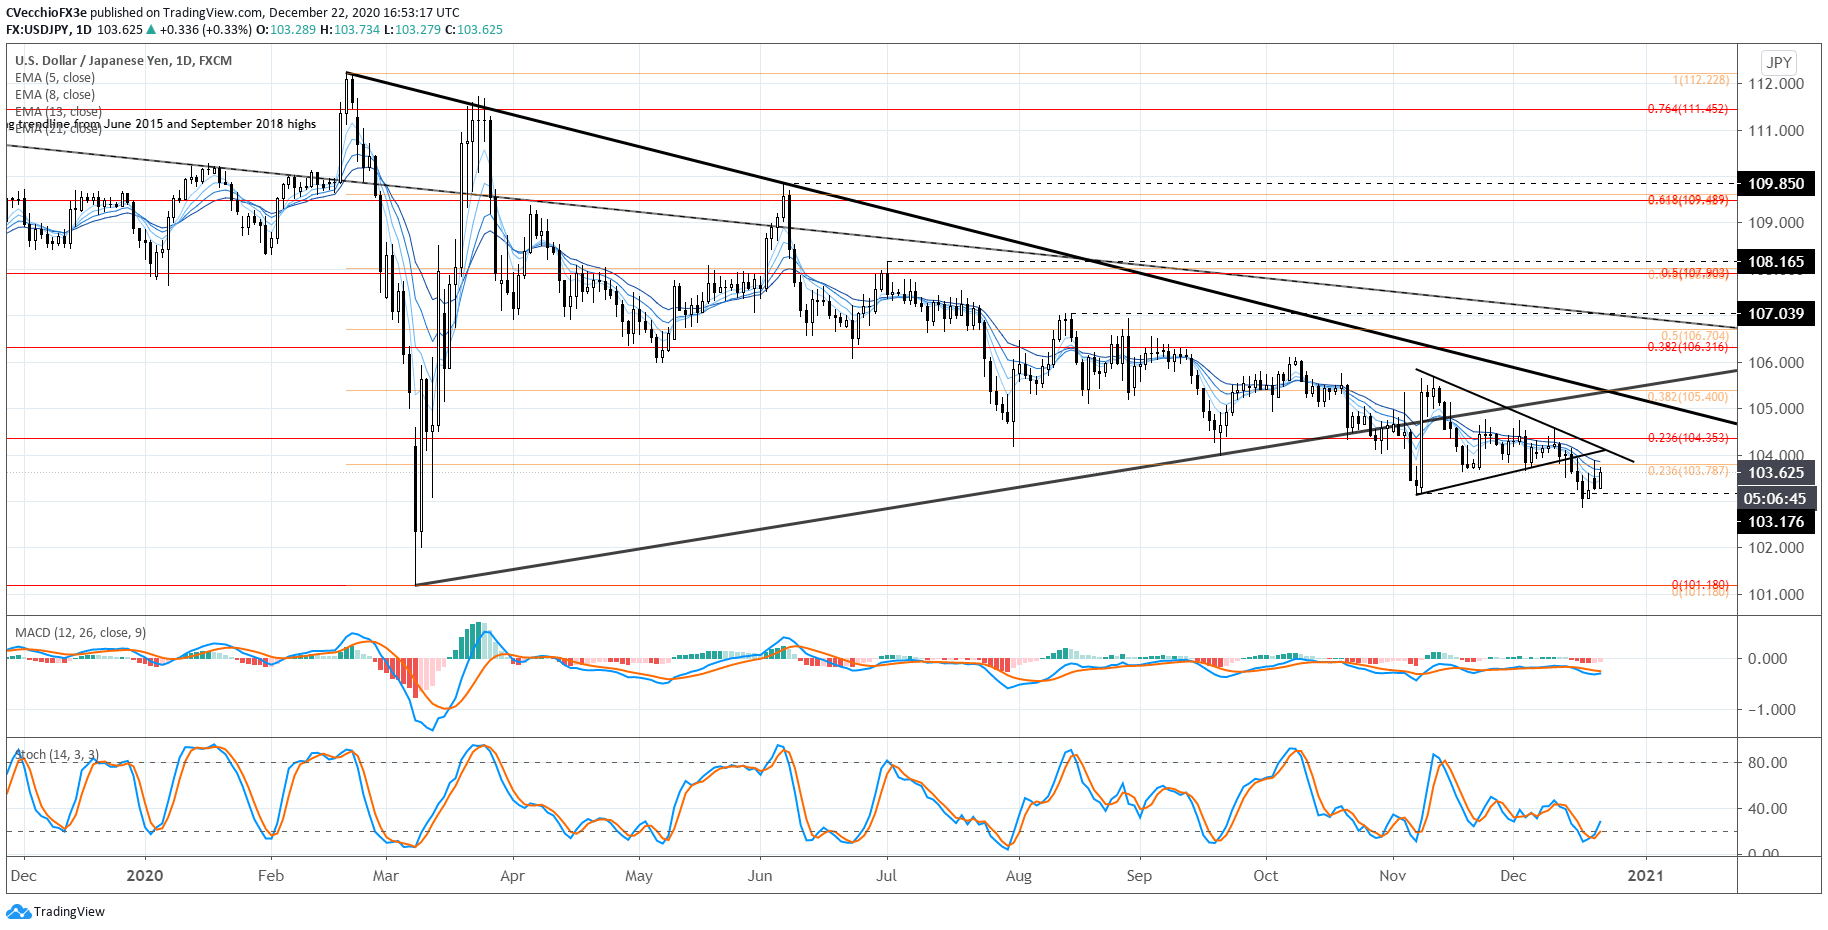
Earlier in the month, it was becoming clear that USD/JPY rates were consolidating in a short-term symmetrical triangle below the uptrend from the March and September swing lows. The breakdown mid-month ultimately yielded a break through the November low (triangle base), suggesting that the next leg of bearish trading was commencing.
But the plans of mice and men (and USD/JPY) often go awry. And it is with USD/JPY’s price action that our view on the broader DXY Index is reinforced: in an environment defined by weaker equity markets, one would expect the Japanese Yen to prevail; instead, USD/JPY is rallying as stocks pullback. Instead, this appears to be another articulation of profit taking in markets ahead of the holiday.
Momentum has been neutralizing in recent days, away from its bullish hue. USD/JPY rates are now above their daily 5-, 8-, and 13-EMAs, but the daily 5-, 8-, 13-, and 21-EMA envelope remains in bearish sequential order. Daily MACD is trending higher but remains below its signal line, while daily Slow Stochastics are rising out of oversold condition. Range trading-like conditions may prevail for the immediate future as the holidays arrive.

IG Client Sentiment Index: USD/JPY RATE Forecast (December 22, 2020) (Chart 3)

USD/JPY: Retail trader data shows 70.37% of traders are net-long with the ratio of traders long to short at 2.38 to 1. The number of traders net-long is 4.57% higher than yesterday and 5.11% lower from last week, while the number of traders net-short is 10.76% higher than yesterday and 9.22% lower from last week.
We typically take a contrarian view to crowd sentiment, and the fact traders are net-long suggests USD/JPY prices may continue to fall.
Positioning is less net-long than yesterday but more net-long from last week. The combination of current sentiment and recent changes gives us a further mixed USD/JPY trading bias.
--- Written by Christopher Vecchio, CFA, Senior Currency Strategist


