


Technical Forecast for the US Dollar: Bearish
- The DXY Index has sustained major technical damage in recent weeks, having broken through the rising trendline from the April 2011 and February 2018 lows. The first weekly gain in four weeks didn’t change this fact.
- Weak monthly seasonality trends in recent years leaves the US Dollar running into headwinds for the rest of the month.
- The IG Client Sentiment Index suggests that EUR/USD and GBP/USD rates could pull back.
US Dollar Breaks Three-Week Losing Streak
The US Dollar (via the DXY Index) posted its first weekly gain in a month, but the lackluster rally may portend more weakness on the horizon. After all, DXY Index has sustained major technical damage in recent weeks, having broken through the rising trendline from the April 2011 and February 2018 lows. The first weekly gain in four weeks didn’t change this fact.
Forex Economic Calendar Week Ahead
The week ahead presents the final ‘full’ week of the year ahead of the holidays, meaning many countries will be releasing their last significant economic data releases of 2020. But the US economic calendar was frontloaded in December, and as such, the coming week offers only a handful of ‘high’ rated events and data releases, all of which come on Wednesday.
Unfortunately for the US Dollar, the trio of ‘high’ rated events and data releases on Wednesday appear to offer little reprieve for what has been a narrative of a gridlocked Washington, D.C. (which we anticipated) and haunting coronavirus pandemic statistics. November US retail sales and the December US Markit Manufacturing PMI Flash both point to a decelerating economy. When the Federal Reserve concludes its December policy meeting and release the latest iteration of its Summary of Economic Projections, which contains fresh growth, inflation, and employment forecasts, the tone is likely to be cautious and worrisome.

DXY PRICE INDEX TECHNICAL ANALYSIS: WEEKLY CHART (NOVEMBER 2016 to DECEMBER 2020) (CHART 1)
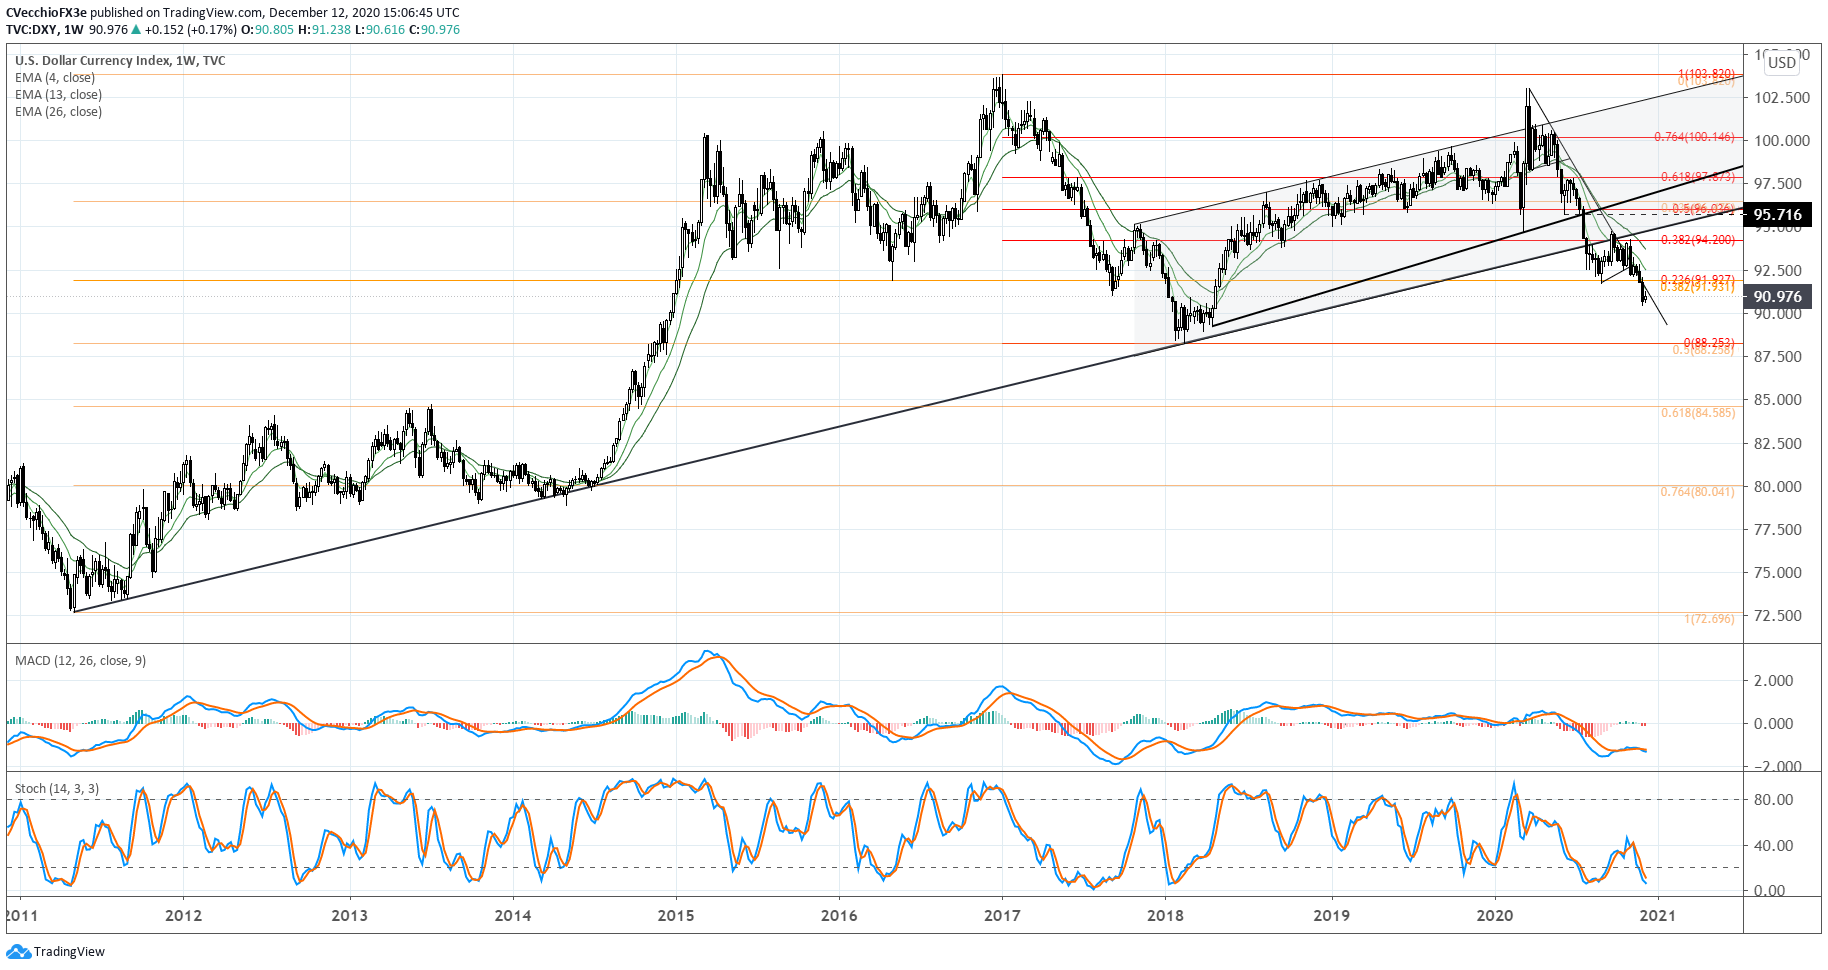
Even as the DXY Index posted its first weekly gain in a month, there’s clear evidence that ‘the damage is done.’ A reconstituted descending trendline from the March and November highs (effectively the pandemic downtrend) shows the DXY Index still trading well-below downtrend resistance.
Bearish momentum remains strong on the weekly timeframe. Weekly MACD is trending lower below its signal line and Slow Stochastics are trending lower in oversold territory. The DXY Index continues to trade below its weekly 4-, 13-, and 26-EMA envelope – the monthly, quarterly, and half-year moving averages.
Furthermore, having broken down through the 23.6% Fibonacci retracement of the 2018 low/2020 high range and the 38.2% Fibonacci retracement of the 2011 low/2020 high range at 91.93, the DXY Index has sustained major technical damage. The next major Fibonacci retracements arrive exactly at the 2018 low.
DXY PRICE INDEX TECHNICAL ANALYSIS: DAILY CHART (DECEMBER 2019 to DECMBER 2020) (CHART 2)
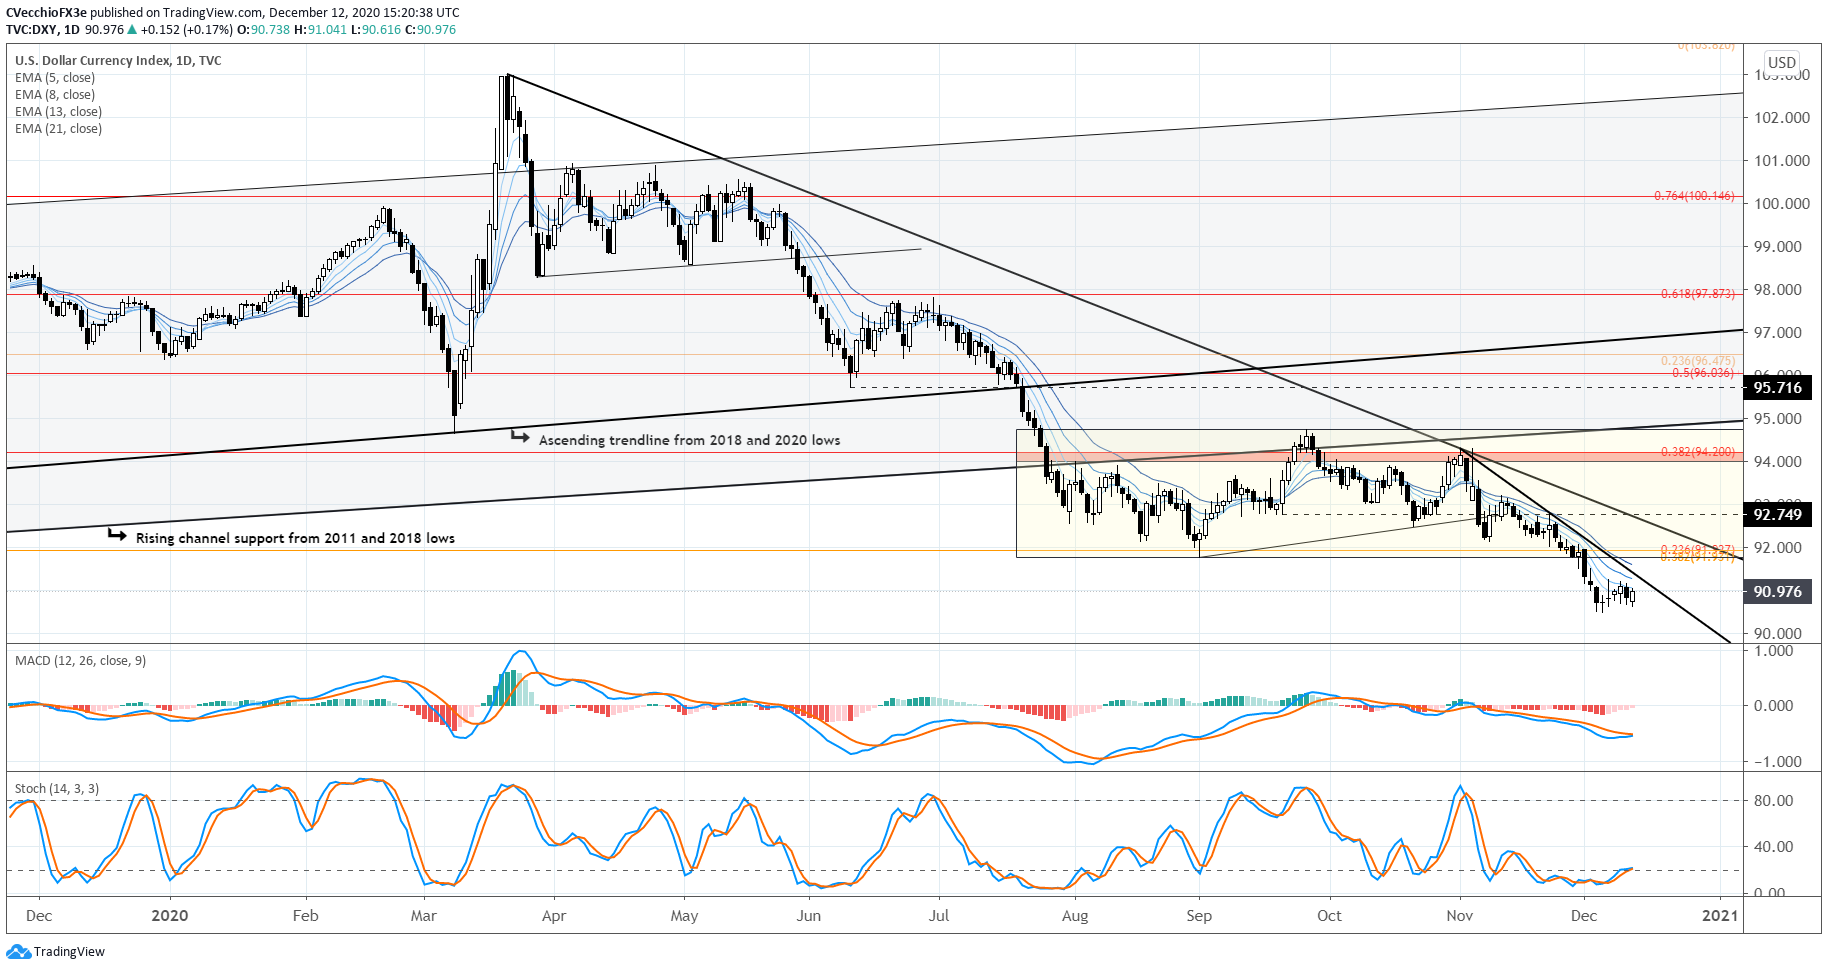
The downtrend in place since the November 1 high remains in place, showcasing how even a weekly gain for the DXY Index failed to produce any meaningful signs of reversal on an important lower timeframe. Contextually, the charts would suggest that the sideways move seen over the past several days is the formation of a bear flag.
As such, the DXY Index remains below its daily 5-, 8-, 13-, and 21-EMA envelope, which is still in bearish sequential order. Daily MACD is now starting to rise in bullish territory, while daily Slow Stochastics is moving out of oversold condition. During flagging patterns, its not uncommon for momentum indicators to lose their overbought/oversold readings without a commensurate change in prices. To wit: the last time that daily Slow Stochastics were at this level (November 18), the DXY Index was trading +1.4% higher (92.31 versus 90.98).
Given that the DXY Index remains below the rising trendline from the 2011 and 2018 lows, as well as the 23.6% Fibonacci retracement of the 2017 high/2018 low range near 91.93, there’s little reason to have faith in any US Dollar rally at this point in time.

CFTC COT US Dollar Futures Positioning (December 2019 to December 2020) (Chart 3)

Looking at positioning, according to the CFTC’s COT for the week ended December 8, speculators increased their net-short US Dollar positions to 6.5K contracts, from the 375 net-short contracts held in the week prior. This is the fifth consecutive week where speculators in the futures market have been net-short. Overall, there have only been two weeks in total since the week ended June 16 where speculators in the futures market have been net-long.
IG Client Sentiment Index: EUR/USD Rate Forecast (December 11, 2020) (Chart 4)

EUR/USD: Retail trader data shows 32.38% of traders are net-long with the ratio of traders short to long at 2.09 to 1. The number of traders net-long is 3.07% higher than yesterday and 0.49% higher from last week, while the number of traders net-short is 2.90% lower than yesterday and 8.13% lower from last week.
We typically take a contrarian view to crowd sentiment, and the fact traders are net-short suggests EUR/USD prices may continue to rise.
Yet traders are less net-short than yesterday and compared with last week. Recent changes in sentiment warn that the current EUR/USD price trend may soon reverse lower despite the fact traders remain net-short.
--- Written by Christopher Vecchio, CFA, Senior Currency Strategist


