


US Dollar Technical Analysis, US Dollar Index, AUD/USD, EUR/USD, GBP/USD – Talking Points:
- US Dollar Index (DXY) eyeing a break above Descending Channel resistance.
- AUD/USD continuing to consolidate within Descending Triangle pattern.
- EUR/USD perched atop pivotal chart support.
- GBP/USD vulnerable to further losses as it carves out Rising Wedge pattern.
A risk-averse environment has fuelled the haven-associated US Dollar’s rebound against its major counterparts, as the tightening of coronavirus restrictions across Europe and the run-in to the US presidential elections on November 3 sours market sentiment.
Here are the key levels to watch for the US Dollar Index (DXY), AUD/USD, EUR/USD and GBP/USD.
US Dollar Index (DXY) Daily Chart – Descending Channel Resistance Under Pressure
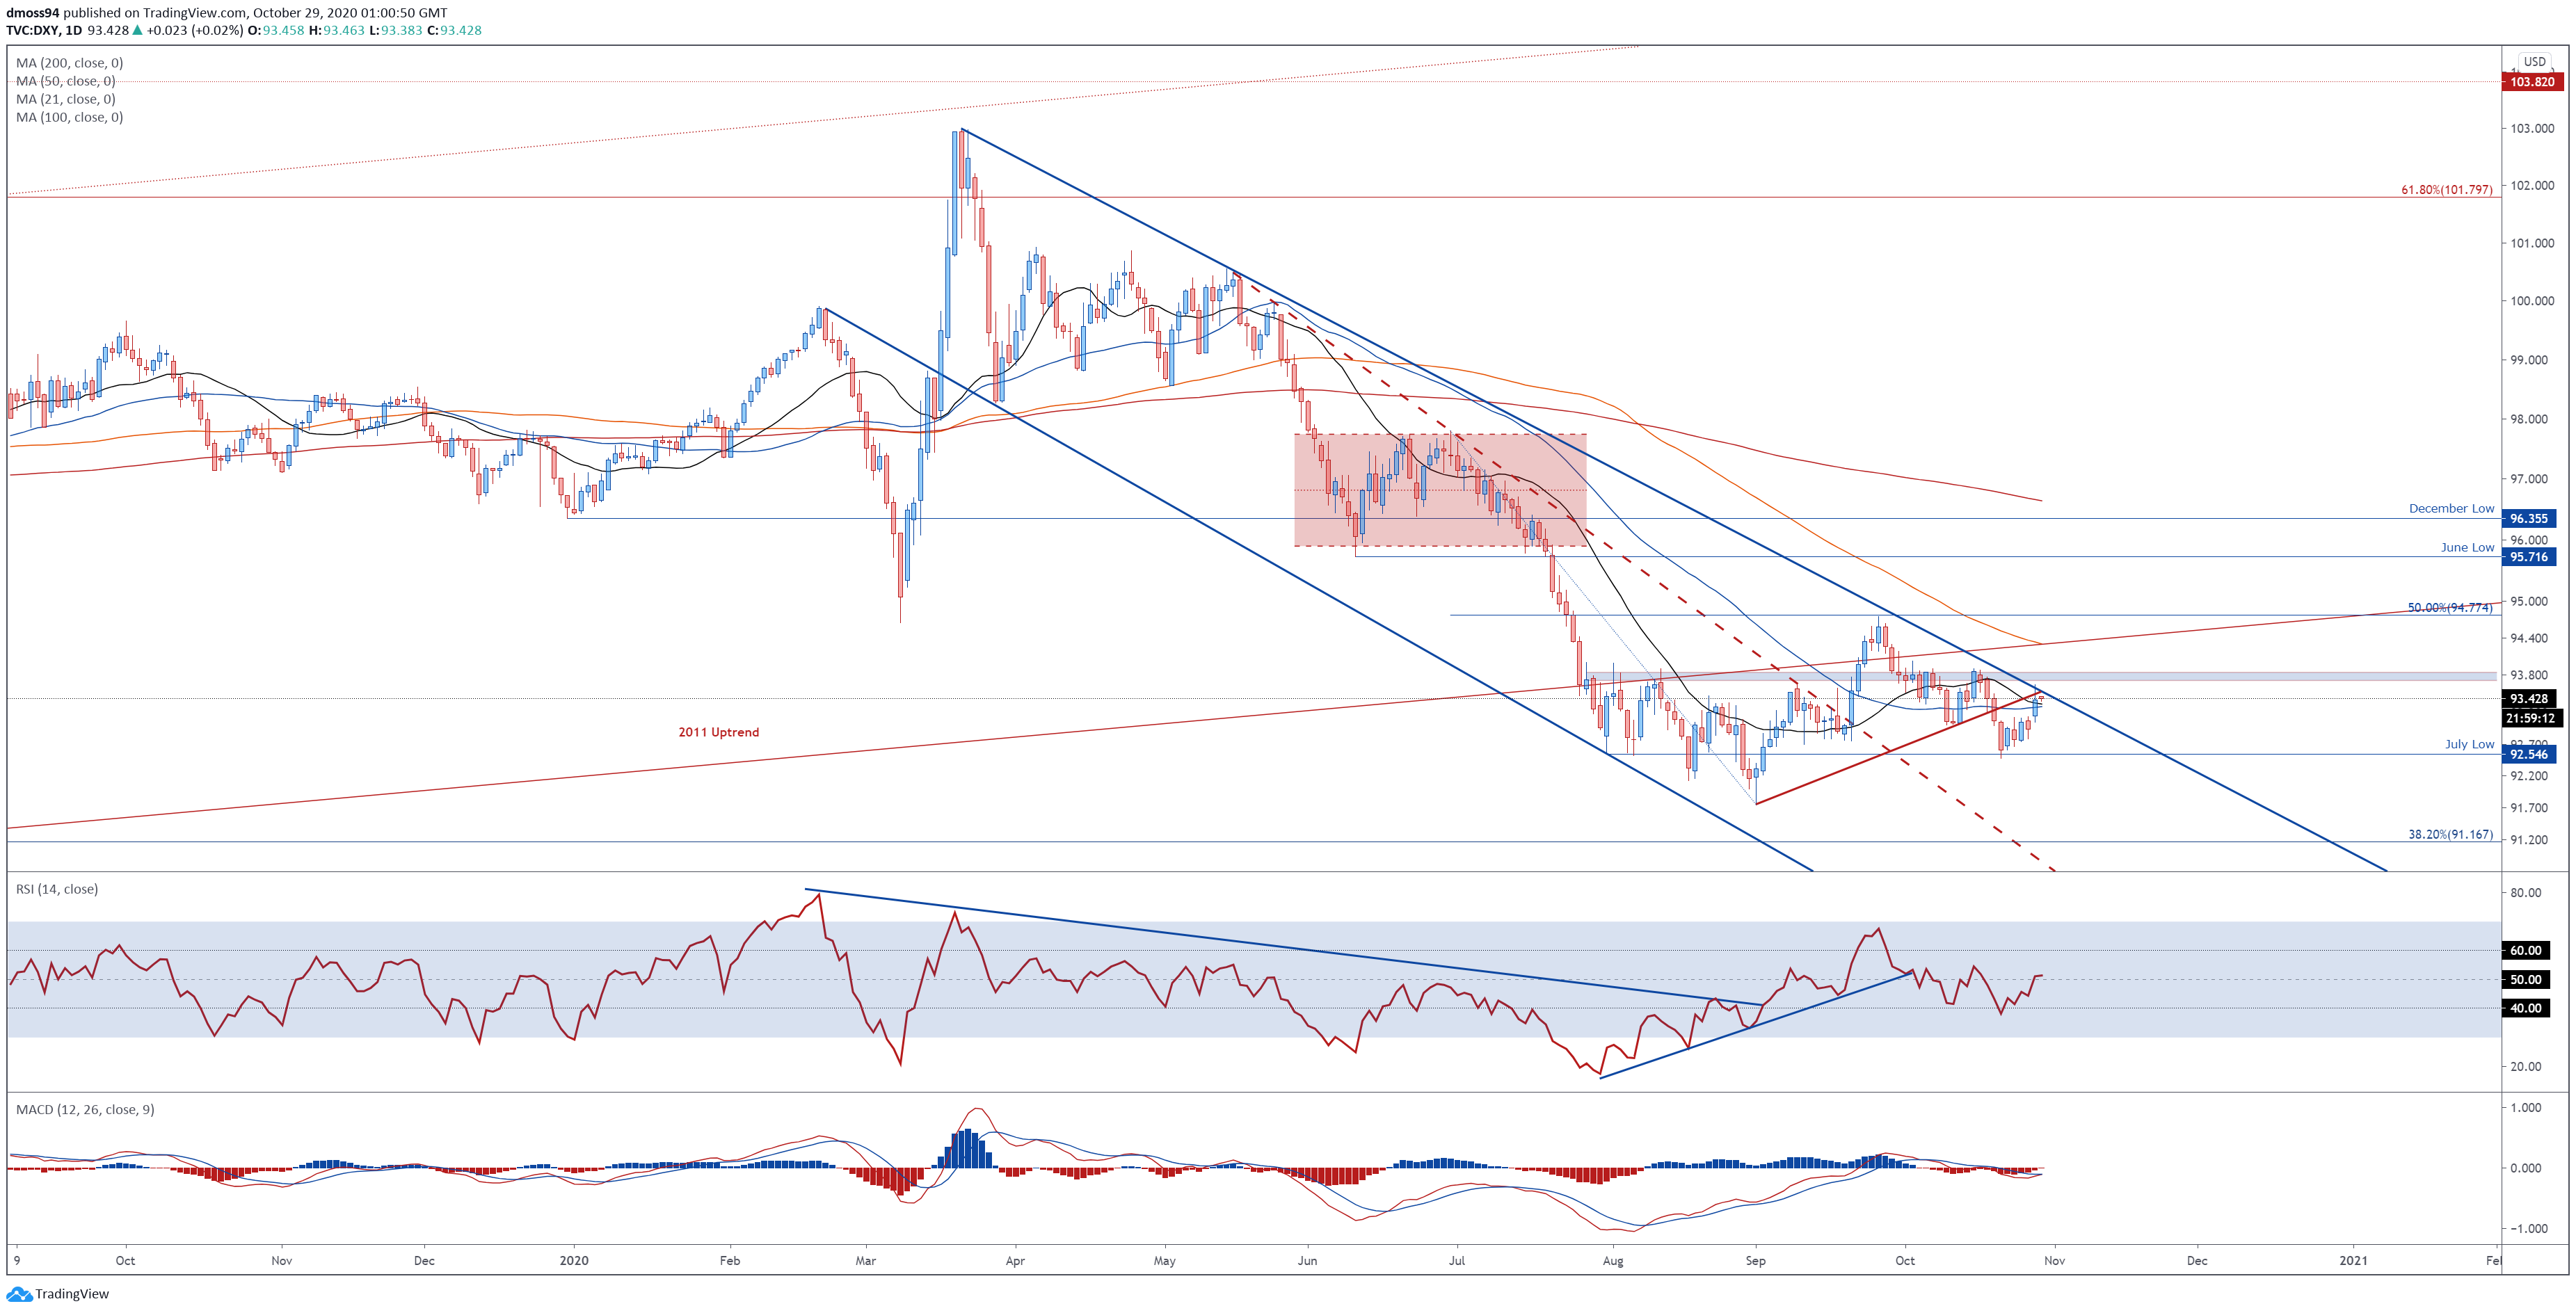
US Dollar Index (DXY) daily chart created using TradingView
The US Dollar Index’s (DXY) rebound from support at the July low (92.55) has pushed price to test a pivotal inflection point at the downtrend extending from the yearly high (102.99) and just shy of a key resistance range at 93.70 – 93.83.
A bullish crossover on the MACD indicator, in tandem with the RSI clambering back above its neutral midpoint, suggests that the Greenback may extends its impulsive push from the monthly low (92.47), as price closed the day back above the trend-defining 50-day moving average (93.29).
That being said, with the DXY still encapsulated within a Descending Channel pattern that has guided price lower since mid-March, a break back above the psychologically imposing 94.00 mark is needed to validate bullish potential.
A daily close above the October high (94.03) would probably generate a more extensive correction and bring resistance at the June low (95.72) back into play.
Conversely, a continuation of the primary downtrend could be on the cards if the 94.00 mark holds firm, with a break and close below the July low needed to carve a path to test the 38.2% Fibonacci (91.17).
AUD/USD Daily Chart – Consolidating Within Descending Triangle

AUD/USD daily chart created using TradingView
AUD/USD rates continue to consolidate in a Descending Triangle pattern above key support at the 0.70 mark, despite plunging 1.23% yesterday as souring market sentiment diverted capital flows into haven-associated assets.
With a multitude of volatility-inducing events on the horizon – US presidential elections and the Reserve Bank of Australia’s interest rate decision – the risk-sensitive currency pair may continue to grind lower in the near term.
Given price continues to track above the sentiment-defining 200-DMA (0.6954) however, the longer-term bias remains skewed to the topside.
Nevertheless, with the RSI and MACD indicator travelling firmly below their respective neutral midpoints, further losses appear in the offing.
Therefore, a pullback towards the support range at 0.6697 – 0.7020 looks likely in the coming days, with a break below opening the door for an extended decline towards the June 15 low (0.6776).

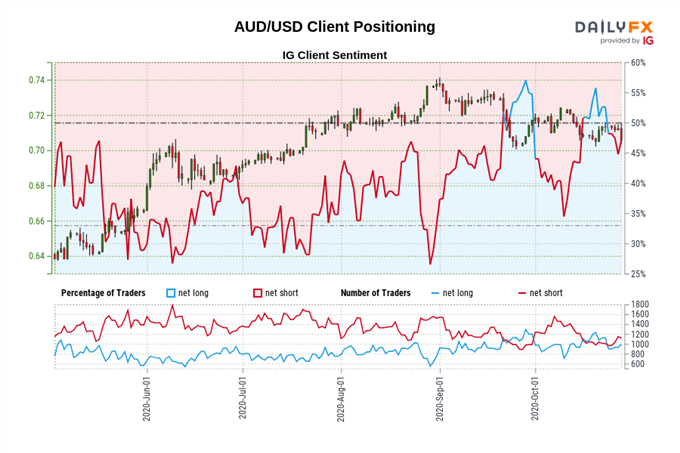
Retail trader data shows 51.63% of traders are net-long with the ratio of traders long to short at 1.07 to 1. The number of traders net-long is 3.52% higher than yesterday and 8.59% lower from last week, while the number of traders net-short is 22.94% lower than yesterday and 4.49% lower from last week.
We typically take a contrarian view to crowd sentiment, and the fact traders are net-long suggests AUD/USD prices may continue to fall.
Positioning is more net-long than yesterday but less net-long from last week. The combination of current sentiment and recent changes gives us a further mixed AUD/USD trading bias
EUR/USD Daily Chart – Plateauing Moving Averages Ominous for EUR Bulls

EUR/USD daily chart created using TradingView
EUR/USD rates look poised to slip back towards the September low (1.1612), as price slices back below the 21-DMA (1.1778) and 50-DMA (1.1749).
A bearish crossover on the MACD indicator, combined with the RSI snapping back below 50, is indicative of swelling bullish momentum and suggests the path of least resistance is lower.
A daily close below the August low (1.1696) could open the door for price to test confluent support at the 38.2% Fibonacci (1.1626) and 100-DMA, with a break below the 1.1600 mark opening the door for EUR/USD rates to slide back to support at the March high (1.1495).
On the contrary, a rebound back towards the monthly high (1.1881) could be on the cards, should price clamber back above the trend-defining 50-DMA (1.1749).

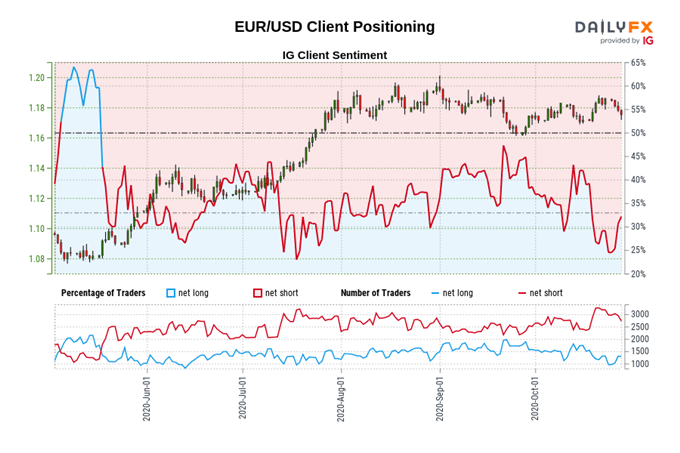
Retail trader data shows 39.46% of traders are net-long with the ratio of traders short to long at 1.53 to 1. The number of traders net-long is 16.29% higher than yesterday and 24.67% higher from last week, while the number of traders net-short is 24.08% lower than yesterday and 29.61% lower from last week.
We typically take a contrarian view to crowd sentiment, and the fact traders are net-short suggests EUR/USD prices may continue to rise.
Yet traders are less net-short than yesterday and compared with last week. Recent changes in sentiment warn that the current EUR/USD price trend may soon reverse lower despite the fact traders remain net-short.
GBP/USD Daily Chart – Rising Wedge in Play?
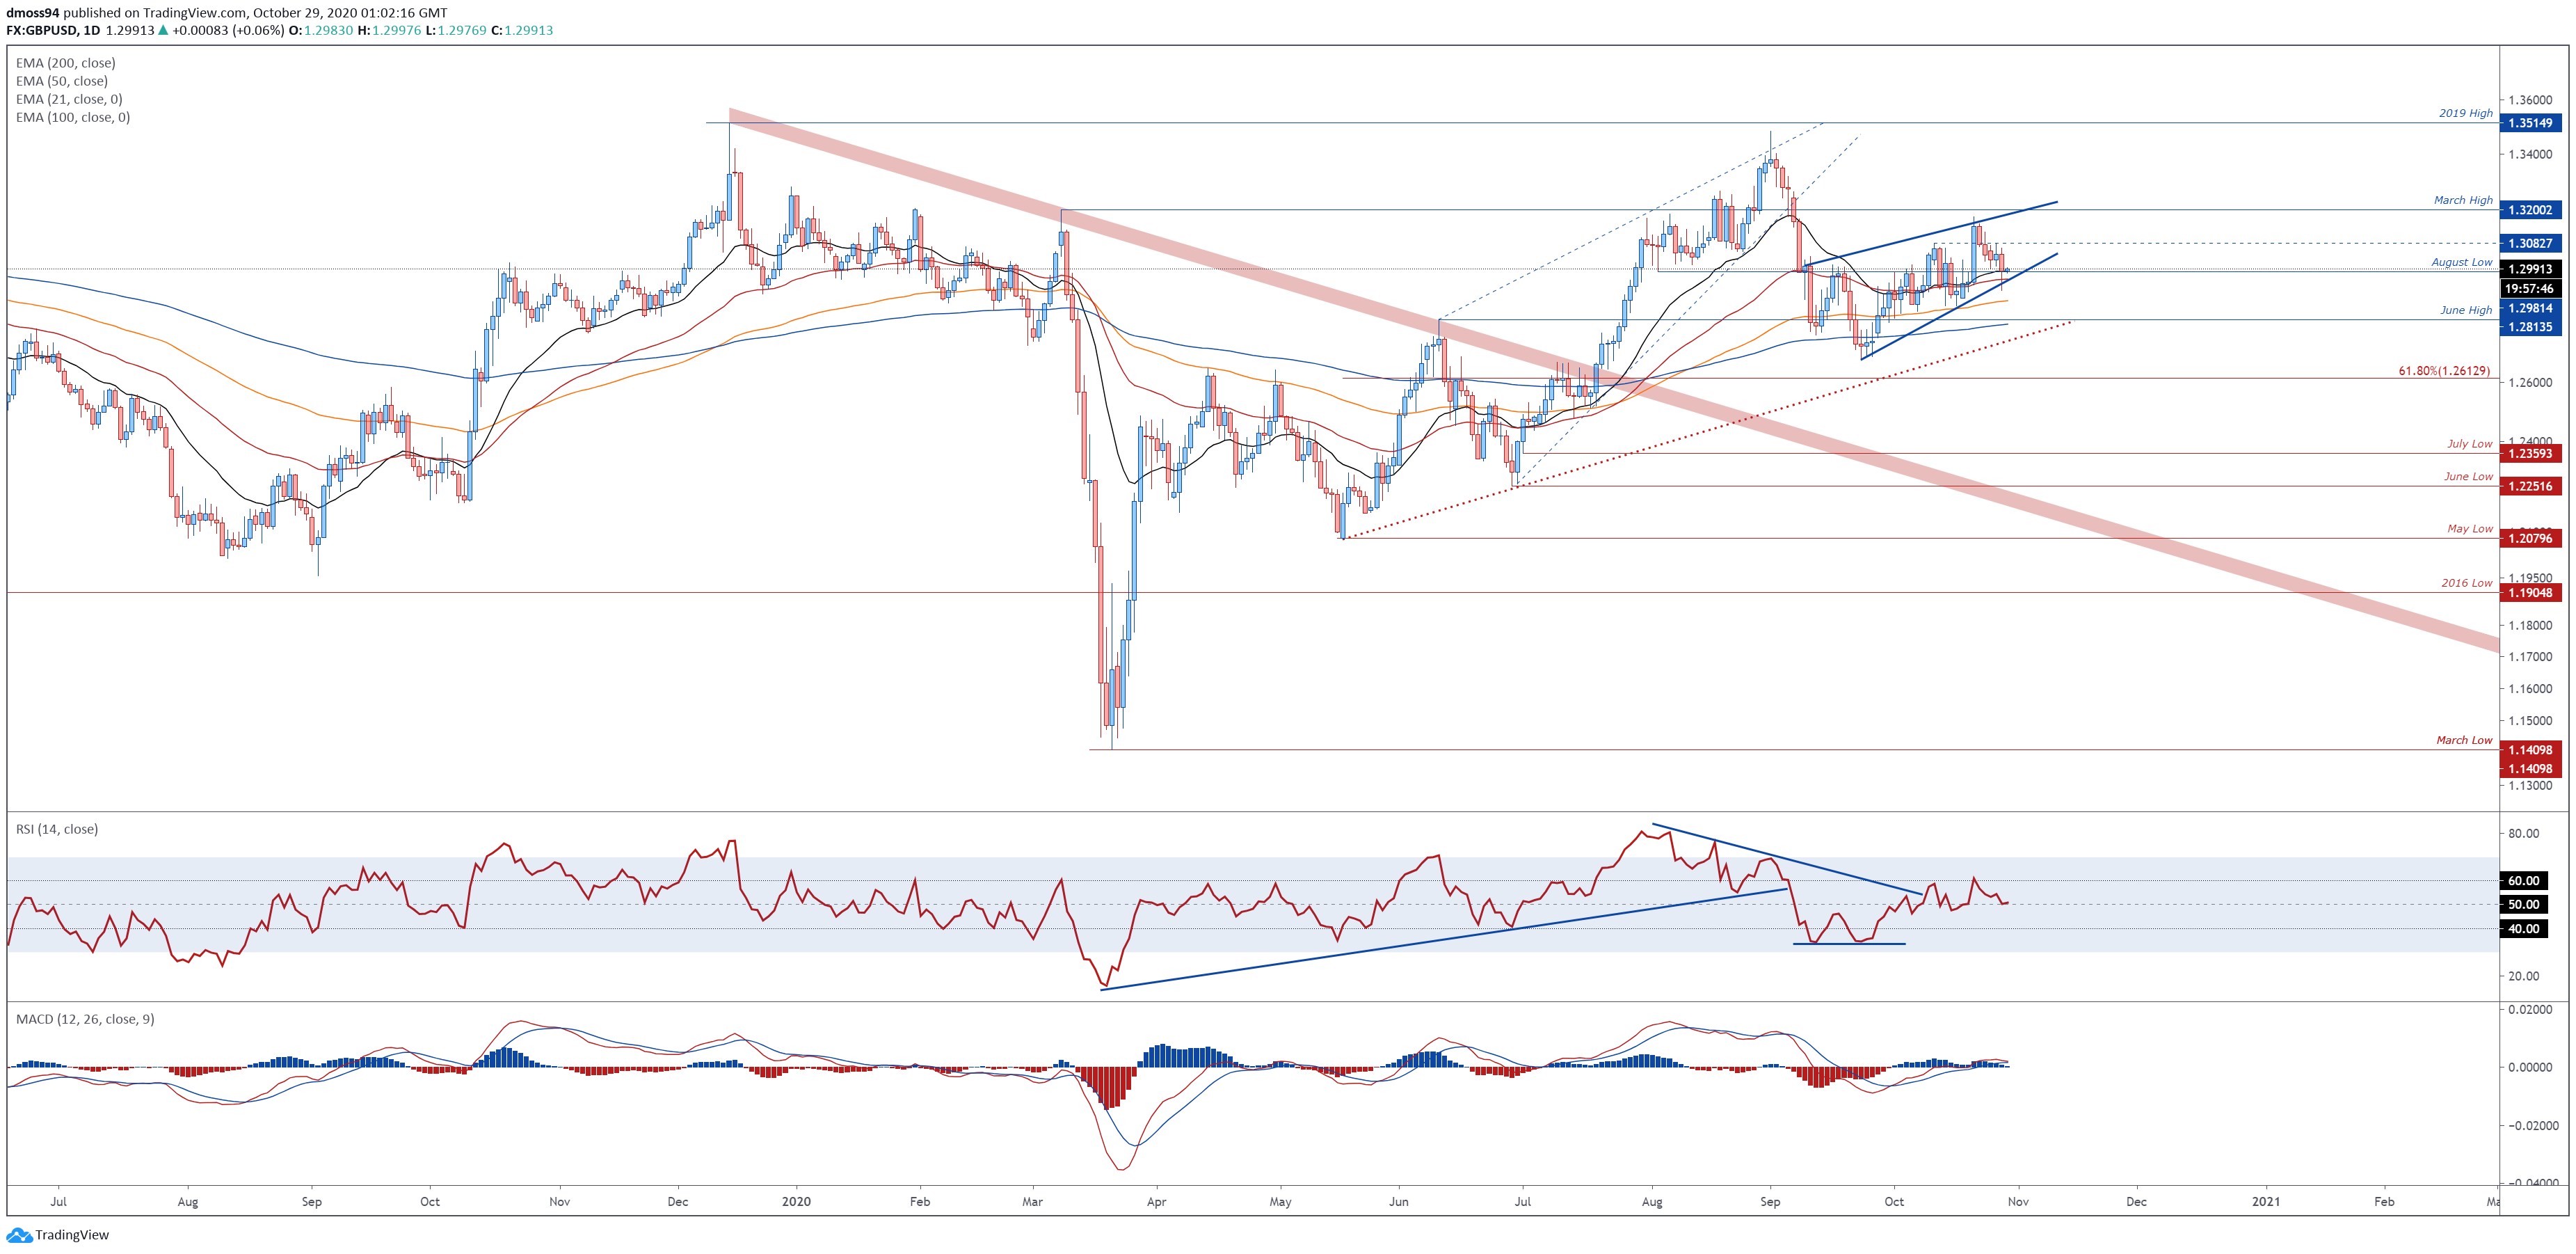
GBP/USD daily chart created using TradingView
The near-term outlook for GBP/USD rates suggests a recovery back towards the 1.3100 mark could be in the offing, as price holds above all four moving averages and key support at the August low (1.2981).
Moreover, with the RSI and MACD indicator tracking firmly above their respective neutral midpoints, the path of least resistance seems skewed to the upside.
However, price appears to be carving out a Rising Wedge continuation pattern, which suggests that a topside push may prove to be a mere short-term rebound.
With that in mind, GBP/USD remains vulnerable to a more extensive correction if buyers are unable to break back above the monthly high (1.3177), with a daily close below the 50-DMA (1.2957) and Rising Wedge support bringing the sentiment-defining 200-DMA (1.2799) into focus.

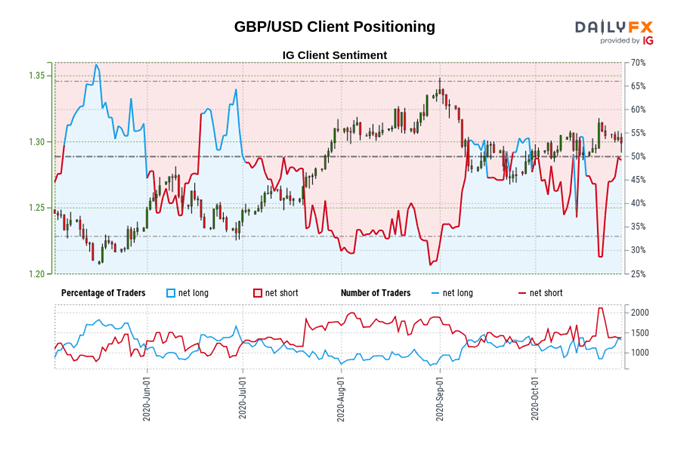
Retail trader data shows 47.58% of traders are net-long with the ratio of traders short to long at 1.10 to 1. The number of traders net-long is 15.60% lower than yesterday and 34.44% higher from last week, while the number of traders net-short is 14.99% lower than yesterday and 36.94% lower from last week.
We typically take a contrarian view to crowd sentiment, and the fact traders are net-short suggests GBP/USD prices may continue to rise.
Positioning is more net-short than yesterday but less net-short from last week. The combination of current sentiment and recent changes gives us a further mixed GBP/USD trading bias.
-- Written by Daniel Moss, Analyst for DailyFX
Follow me on Twitter @DanielGMoss


