


US Dollar Index (DXY) Talking Points:
- The ONE Thing: The US Dollar strength may be a simple reversion. When looking at a weekly chart of the US Dollar Index, the strength found in mid-April matched that found in July 2014. What’s more is that when looking at a long-term price channel drawn off a 2007 momentum extreme, the momentum happened at the same level along the time continuum. Technically speaking, it may have just been time for the US Dollar to strengthen.
- Tuesday saw currencies not named the US Dollar take a beating with a focus on Emerging Markets with the South African Rand down 2% and the Mexican Peso down 1% on the session. While some saw the upward reversion of retail sales for March as a catalyst, there may be a bigger shift developing that can be seen in higher yields across the US Treasury yield curve, which has seen a parallel shift higher of late.
- Cash, an index class marked by the 3-month US Treasury Bills have become a contender again, and that may mean more capital flows into the US Dollar. When looking at the return offered by 3-month government debt, it now aligns with the S&P 500’s dividend yield for the first time since 2008. Such a development is seen as an inflection point and may cause the US Dollar to firm further over time.
Long-Term Technical Levels For US Dollar Index:
Resistance:94.46/96.01 (November closing high/ 50% retracement of 2017/2018 range)
Spot: 92.83
Support:91.46/90.93 (200-DMA/ 26-Day Midpoint from Ichimoku’s Kijun-Sen)
Weekly US Dollar Chart: Aggressive Strength Off Channel’s Lower Bound
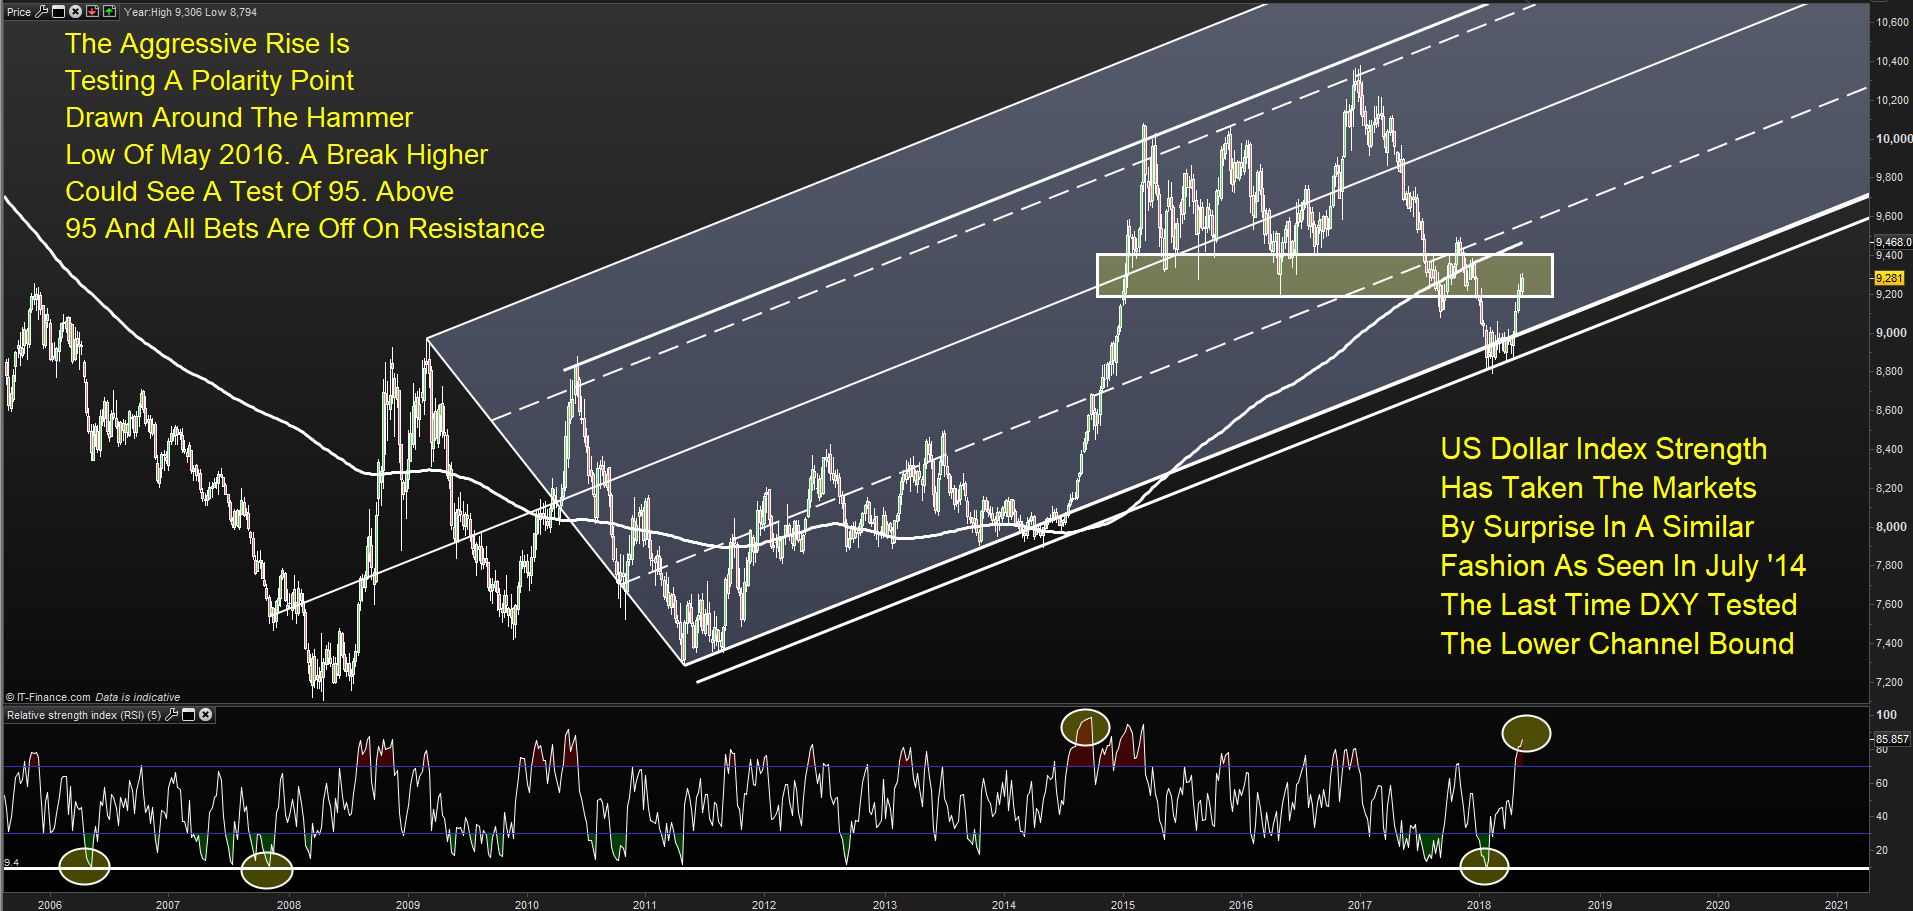
Chart Source: Pro Real Time with IG UK Price Feed. Created by Tyler Yell, CMT
Unlock our Q2 forecast to learn what will drive trends for the US Dollar through 2018!
The US Dollar Index pushed to fresh 2018 highs on Tuesday in what looks like an aggressive unwind of recently established short positions. From a fundamental perspective, you could say the move was triggered as NY Fed Inflation Expectation Survey showed 3% as consensus over 1- and 3-years out. Additionally, bond markets are seeing new trend highs in 10-year yields,and the US Treasury 2's versus 10's curve has steepened the market’s convention on inflation and a more aggressive Fed.
Traders are likely to engage in opportunistic or tactical long US Dollar trades after tactical US Dollar short trades were invalidated. See one here.
The strength since mid-April may best be viewed through the lens of the weekly chart that showed a deeply oversold US Dollar via the RSI(5) that was due for a bounce. Now, a move toward the 200-WMA may be in store near 95 if the move higher continues and the support levels above holds.
Daily Dollar Index Via Ichimoku Says Trend On!
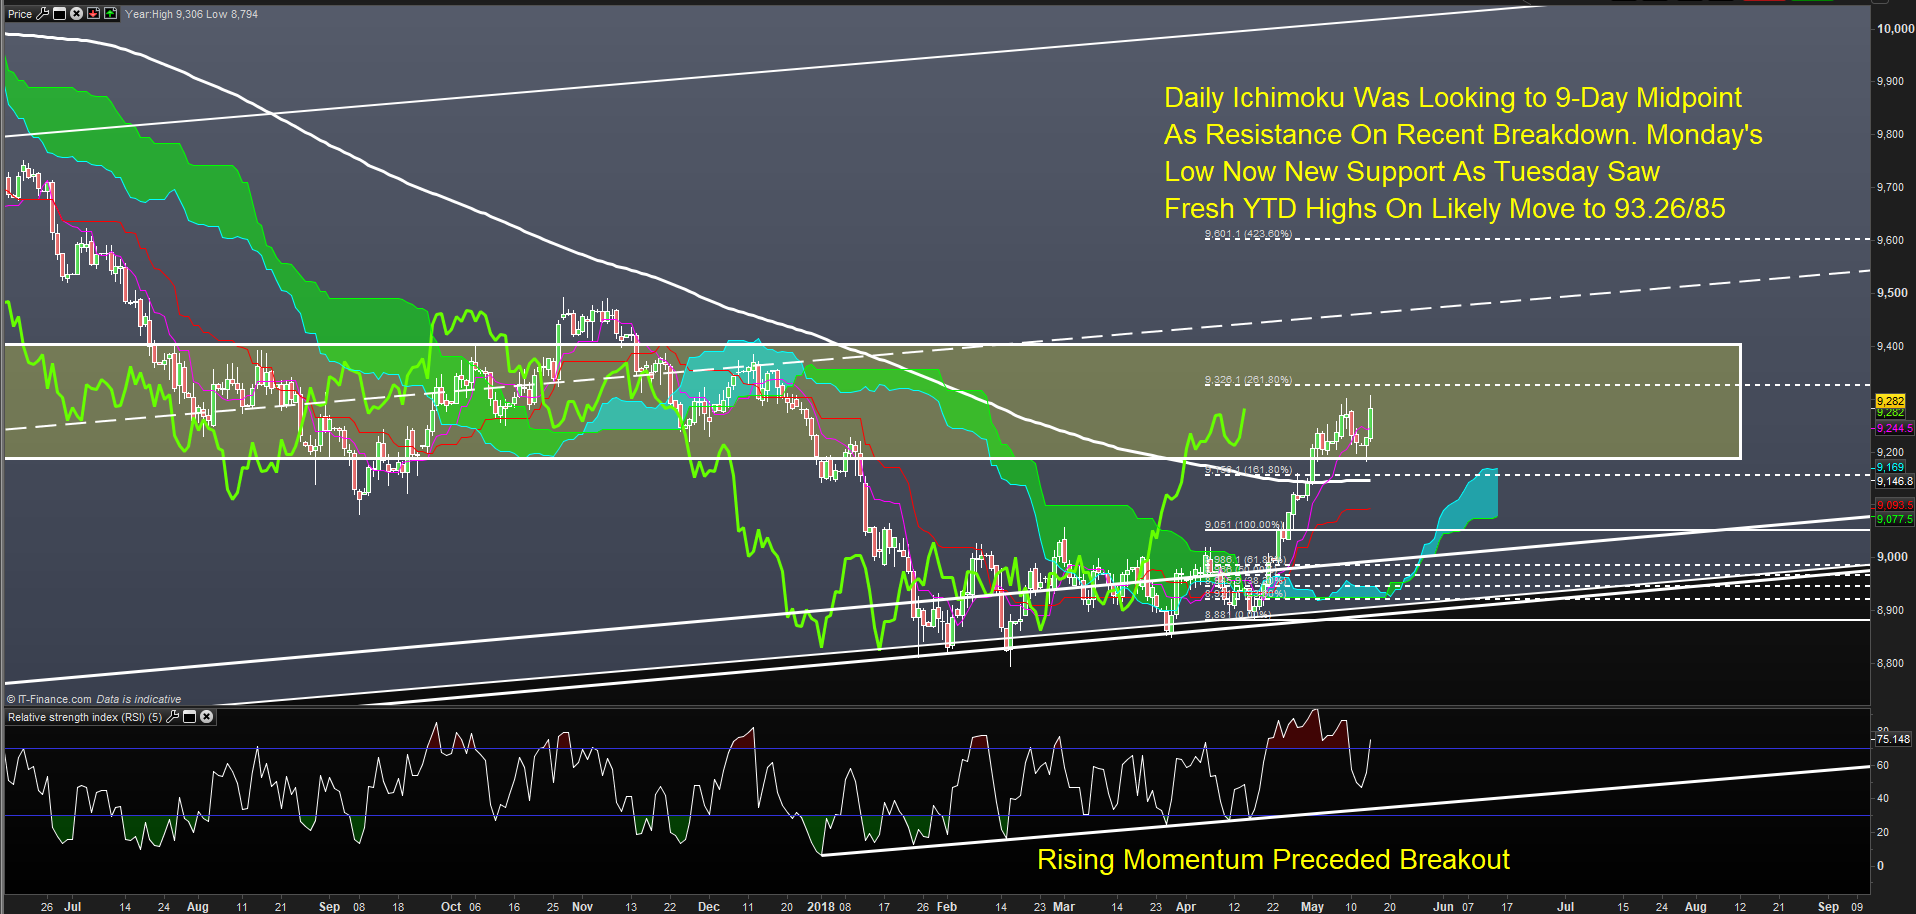
The daily chart with Ichimoku applied has one interpretation: Trend on. Previously, we mentioned the 9-period midpoint at 92.44 may now act as resistance. That did not hold, andnow Monday’s low and the 200-DMA at 91.83/46 respectively should be looked to as support for what could be a broad move higher.
Not familiar with Ichimoku? You’re not alone and in luck. I created a free guide for you here
Recommended Reading: 4 Effective Trading Indicators Every Trader Should Know
New to FX trading? No worries, we created this guide just for you.
More For You:
Are you looking for longer-term analysis on the U.S. Dollar? Our DailyFX Forecasts for Q2 have a section for each major currency, and we also offer an excess of resources on USD-pairs such as EUR/USD, GBP/USD, USD/JPY, AUD/USD. Traders can also stay up with near-term positioning via our popular and free IG Client Sentiment Indicator.
Forex Trading Resources
DailyFX offers a surplus of helpful trading tools, indicators, and resources to help traders. For those looking for trading ideas, our IG Client Sentiment shows the positioning of retail traders with actual live trades and positions.
Our trading guides bring our DailyFX Quarterly Forecasts and our Top Trading Opportunities, and our real-time news feed has intra-day interactions from the DailyFX team. And if you’re looking for real-time analysis, our DailyFX Webinars offer numerous sessions each week in which you can see how and why we’re looking at what we’re looking at.
If you’re looking for educational information, our New to FX guide is there to help new(er) traders while our Traits of Successful Traders research is built to help sharpen the skill set by focusing on risk and trade management.
---Written by Tyler Yell, CMT
Tyler Yell is a Chartered Market Technician. Tyler provides Technical analysis that is powered by fundamental factors on key markets as well as t1rading educational resources. Read more of Tyler’s Technical reports via his bio page.
Communicate with Tyler and have your shout below by posting in the comments area. Feel free to include your market views as well.
Discuss this market with Tyler in the live webinar, FX Closing Bell, Weekdays Monday-Thursday at 3 pm ET.
Talk markets on twitter @ForexYell


