


Talking Points:
- DXY Technical Strategy: DXY remains in “sell the rips” mode below 94.08
- DXY appears to be bouncing off an extreme downside target, may be subject to month-end flows
- Fed Funds Future bets take the probability of a Fed hike in 2017 down to 1/3
- IG Client Sentiment Highlight: EUR (57.6% of DXY) sentiment favors ST test lower
Beware of month end flows. They can be a squirrelly bunch. As explained in response to a question by a faithful attendee of FX Closing Bell, month end flows are typically erratic after a strong trend had taken place over the month, such as the mind-numbingly weak US Dollar. Funds from around the world to lock in gains on the foresight that shorted the USD at the beginning of the month or at earlier times in the year will close out their short DXY trade. The flows from this act will result in entering a long position to neutralize the short, and in so doing provide a short-term lift to the previously downtrodden currency.
Add to month-end flows;the US had a double punch of positive data points on Wednesday. First, GDP for 2Q beat estimates and came alongside an ADP employment data, ahead of Friday’s Non-Farm Payroll number, which also beat economist’s expectations. After the positive round of US data, DXY pushed higher and took EUR & JPY to session lows. The EUR fell below the Jackson Hole breakout level of 1.1910, and internal structural support looks to 1.1828 as support. A break and close below this level may signal a deeper setback is under way.
Equally impressive is the move lower in JPY. USD/JPY pushed to a weekly high of 110.44, breaking above the base line of Ichimoku (26-day midpoint), and pushing further away from the YTD low set in April at 108.13. The strong push away from the price range of the bearish extreme for 2017 opens up a test to 110.95. We should be on the watch for a further breakdown if risk-off sentiment gathers pace. However, it is fair to say that the market has defended 108.13 very well and it is difficult to build short exposure just above this point.
Both EUR & JPY make up the largest percentage of the DXY, so they are worth analyzing individually when looking to the DXY.
Want to learn how to trade from our experts? We recently updated and added new trading guides here.
When looking at the DXY chart, you can see we have bounced along the bottom of a bearish channel that earlier helped to catch the low in late July. By no means am I arguing that the DXY downtrend is done for 2017.Even if it is, far be it from me to be as bold to call for such on so little evidence. From a fundamental perspective, Fed Funds Future bets take theprobability of a Fed hike in 2017 down to 1/3. However, it is worth noting that given the month-end volatility, the retracement in EUR/USD and USD/JPY, and the potential upswing in US Data, we could see a retracement that makes a blind US Dollar Index short position unwise on many accounts.
Strong resistance to the anticipated corrective move higher would be 93.03 and 94.08. Rallies will likely be sold here as the hedge funds that have built up their short positions, those who have yet to close out will likely work to defend their position. Only upon a break of 93.03/94.08, would it be worth shifting from a bearish bias on USD longer term to neutral.
If you would be interested in seeing how retail traders’ are bettingin key markets, see IG Client Sentiment here !
Join Tyler in his Daily Closing Bell webinars at 3 pm ET to discuss this market.
DXY below 94.08 keeps thefocus on downside extension, EUR/USD >1.1828
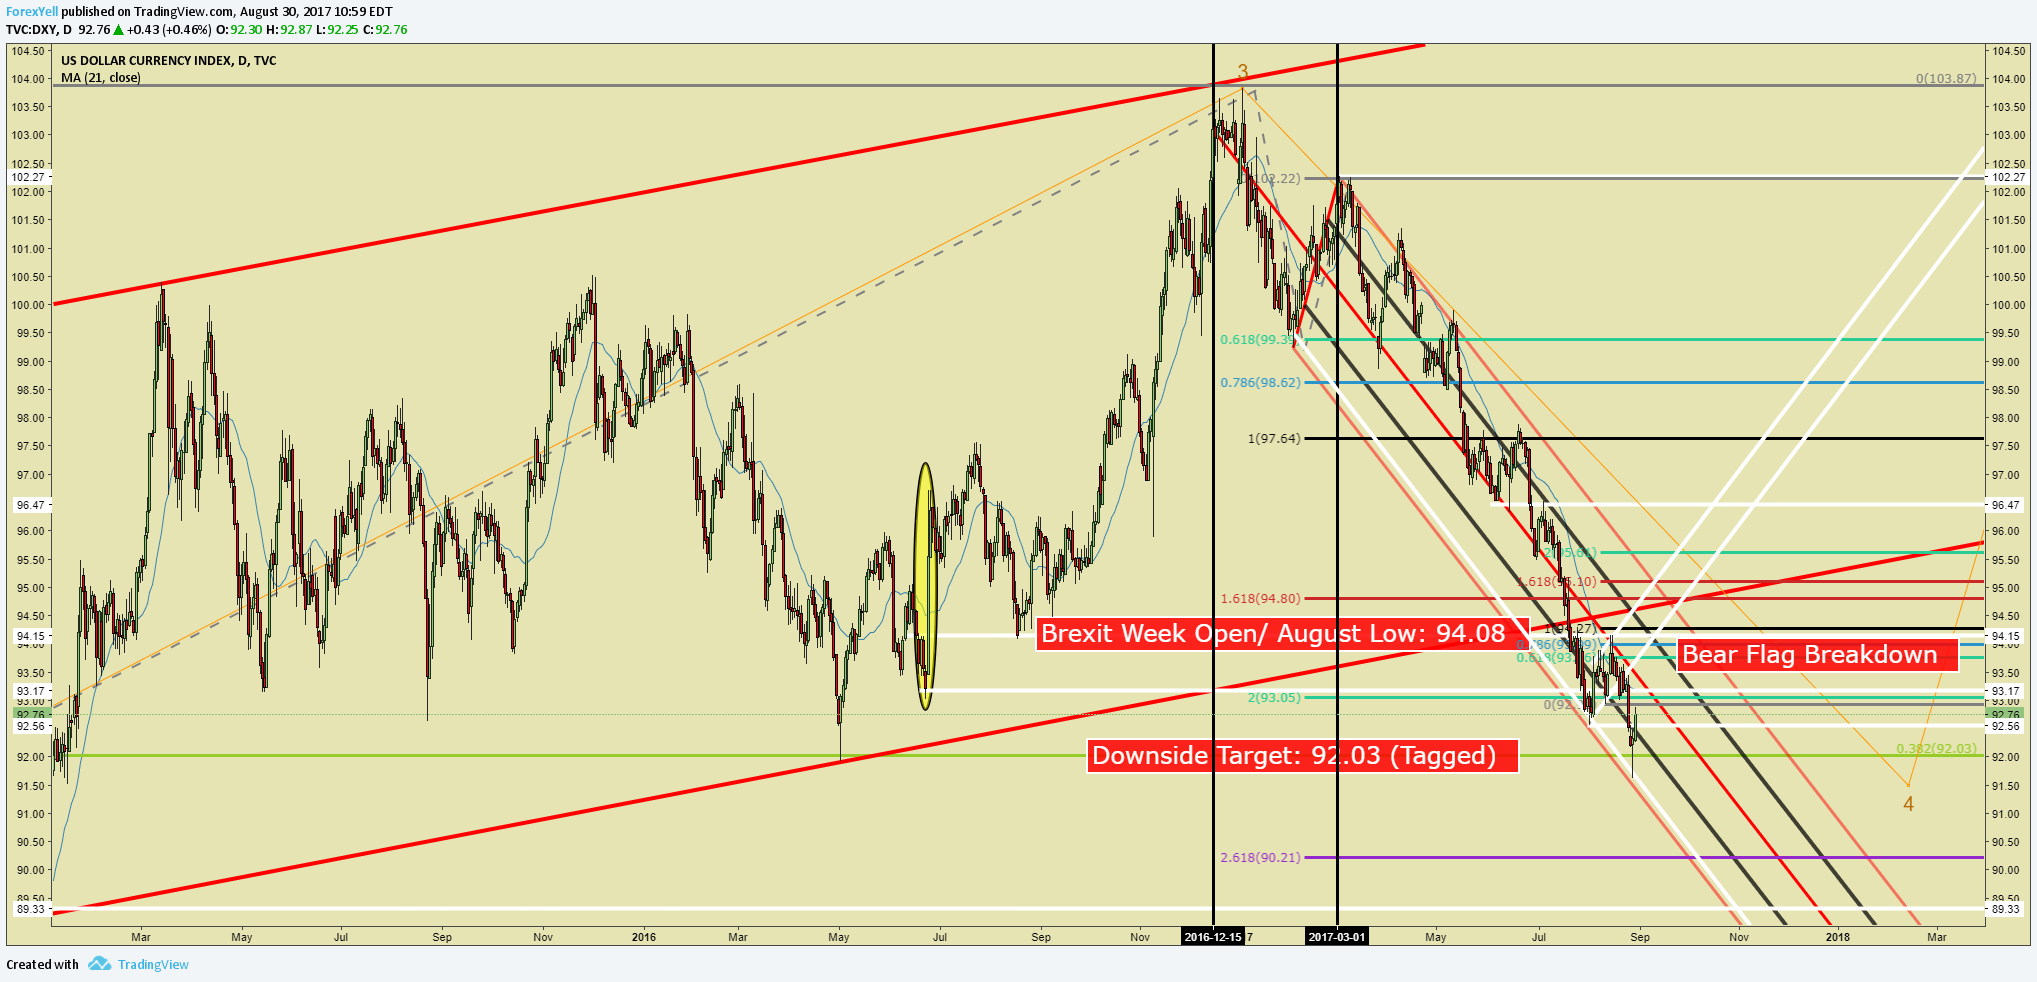
Chart Created by Tyler Yell, CMT
IG Client Sentiment Highlight: EUR (57.6% of DXY) sentiment favors further upside in EUR/USD
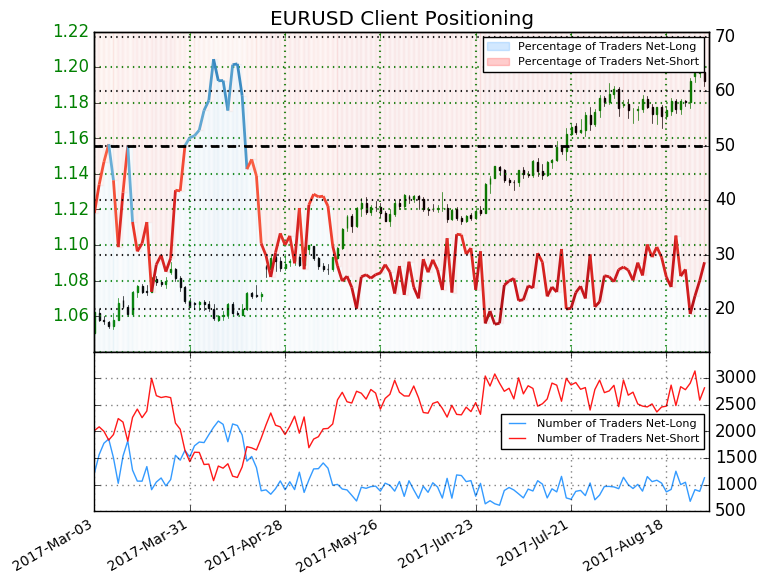
EURUSD: Retail trader data shows 28.6% of traders are net-long with the ratio of traders short to long at 2.49 to 1. In fact, traders have remained net-short since Apr 18 when EURUSD traded near 1.07646; price has moved 10.7% higher since then. The number of traders net-long is 17.7% higher than yesterday and 11.2% lower from last week, while the number of traders net-short is 6.4% lower than yesterday and 10.0% higher from last week.
We typically take a contrarian view to crowd sentiment, and the fact traders are net-short suggests EURUSD prices may continue to rise. Positioning is less net-short than yesterday but more net-short from last week. The combination of current sentiment and recent changes gives us a further mixed EURUSD trading bias. (Emphasis mine)
---
Written by Tyler Yell, CMT, Currency Analyst & Trading Instructor for DailyFX.com
To receive Tyler's analysis directly via email, please SIGN UP HERE
Contact and discuss markets with Tyler on Twitter: @ForexYell


