


Talking Points:
- Dollar Technical Strategy: eyes on opening range low, sharp, but short-lived sell-off possible
- Details of FOMC Minutes Will Drive US Dollar Today
- RSI (5) divergence clearly displaying below resistance
The opening range for the US dollar index (DXY) deserves the attention of currency traders given how it finished 2016 as the clear winner in G10FX. As of Tuesday, the USD looked to be starting the new year on a strong note as it appeared positioning was rebuilding for the bulls. However, a look at the chart shows that the market is having a difficult time bidding the USD above 103.20 on a closing basis at the same time bearish RSI (5) divergences developing.
Much of the firm USD over the past few months developed on the sharp drop in US treasuries that lifted the yields across the curve higher. The catalyst was a more hawkish than anticipated Federal Reserve on December 14 combined with monetary policy divergence among other developed economy central banks. While much of this move has been attributed to a widening spread of sovereign yields; it appears that market nerves that could tighten the yields that could also hurt the bullish prospects for DXY in the near term.
Looking for additional trade ideas for your favorite market? Read Our 2017 Market Forecast
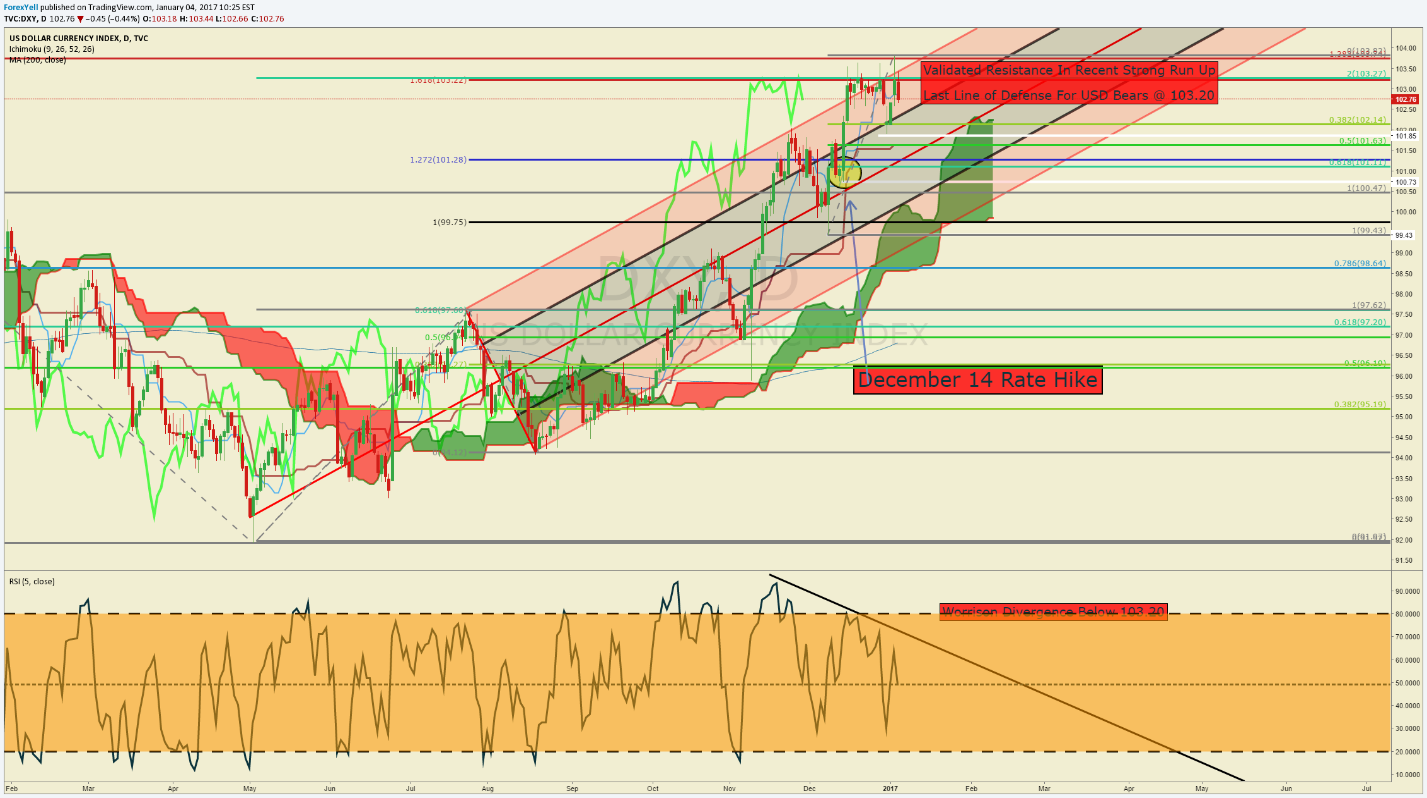
The chart below shows a handful of technical tools. First, the Ichimoku Cloud continues to show that the overall environment favors a bullish bias unless the price for a break below 101, which would turn the market from bullish to neutral. Second, a few Fibonacci expansion tools help show a confluence of resistance at 103.20, which is also where the USD has had a difficult time attracting additional bids. Fibonacci is a tool to help explain the growth prospects of a move, and can also help show when a move may be running out of steam. It is fair to say that an inability for DXY to close above 103.20 could indicate that a sharp, but likely short-lived retracement is how the USD will ring in the first month of trading for 2017.
While the dollar retracement is not a widely shared view, we are seeing bearish divergence on RSI (5) that might be indicative of a retracement developing. The first level we will watch to validate whether or not a sharper selloff is developing in USD would be a break below the opening range low for 2017 of 102.14. A break below there would indicate a sharp retracement that could test the December 14 low where the Federal Reserve shocked markets by increasing the median Dot Plot up 25 basis points in addition to raising rates that help influence the current dollar rally.
A fundamental component worth watching is the upcoming FOMC minutes that might show the Dot Plot hawkishness was concentrated to a few members will no longer be voters next year, and that may be replaced by more dovish meaning members of the Federal Reserve. Such a development would likely act as a catalyst for a tightening of yields and a sharper dollar selloff in the coming days. However, we do not favor the view of a long-term top being put in place. A close above 103.20, whenever that developed would validate the view that a bullish resumption is in play.
DXY Showing Strong Respect For 103.20 As RSI(5) Shows Bearish Divergence
Shorter-Term DXY Technical Levels for January 4, 2017
For those interested in shorter-term levels of focus than the ones above, these levels signal important potential pivot levels over the next 48-hours of trading.

T.Y.


