


Talking Points:
-US Dollar Technical Strategy: Stalling Near March Deserves Our Attention
-3M USD LIBOR 7-Year Highs May Be Indicative Of Increasing USD Strength
-Monday’s Comments from Bullard Continue to Pour Cold Water on Multi-Hike Hypothesis
The price of DXY has traded consistently higher over October and looks to close the month strong. While economic strength in the U.S. has not been what Fed officials would likely hope, the counterparts of the DXY such as EUR at 57.6%, Japanese Yen at 13.6%, British Pound at 11.9%, and Canadian Dollar at 9.1% have all had reasons for weakening, which has lifted the DXY.
Given the majority of EUR weighting on DXY, the charts can look nearly inverse. Friday’s CFTC Commitment of Trader’s report showed the institutional speculators had increased their bearish positioning the most since July. The data was from Tuesday of last week, which was before the European Central Bank Policy Meeting had Mario Draghi noting that they discussed neither a bond-purchase taper nor expanding QE.
EUR/USD Chart Recently Broke Trend Support, Faces March Lows
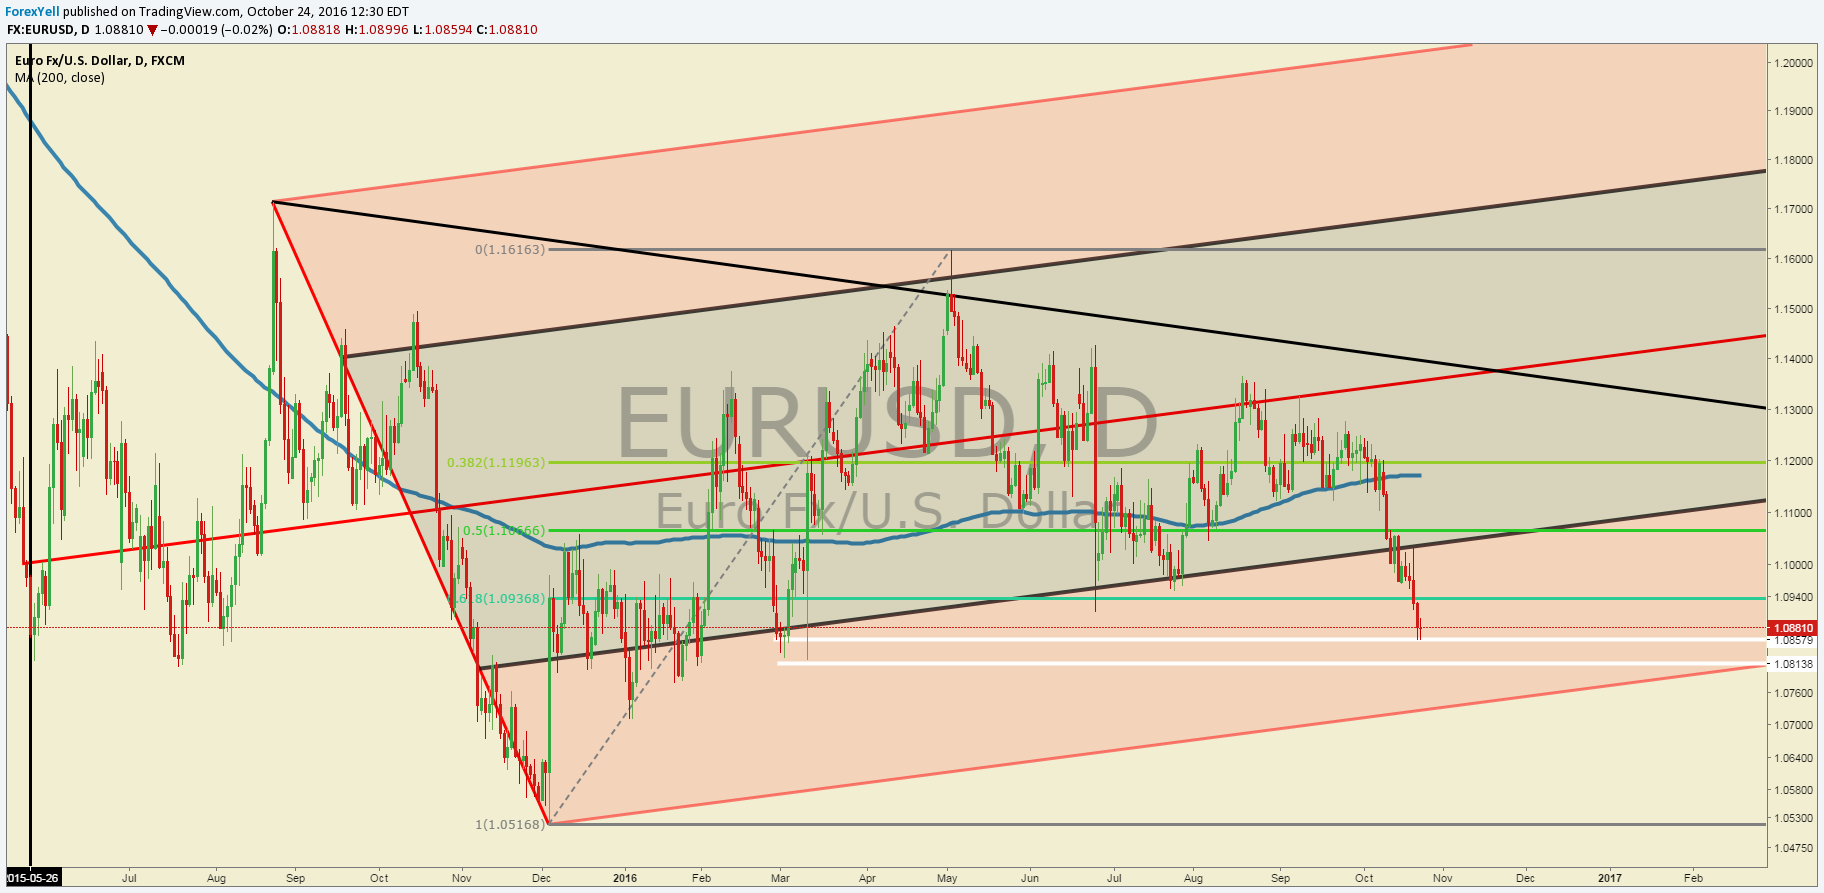
Many traders are looking at the DXY as the most likely catalyst for a strong currency trend after months of disappointment on failed breakouts and consistent trends. You can see on the chart above the EUR/USD traded down to 1.09/08 over the last few sessions, which are levels we have not seen since March. While ECB appears on hold, there is a valid question about how much the Fed will do to constrict monetary policy from current levels. There is currently a ~68% probability of a Fed Hike at the December meeting, but it’s hard to say what dialogue would come alongside the hike, and how that could hurt the USD. The Fed is expected to provide a dovish hike where they assure the market they are willing and able to act to accommodate markets if needed.
On Monday, St. Louis Fed Reserve President James Bullard continued his uniquely dovish tone by saying that FOMC members have to adjust their long-term numbers down. Over the summer, Bullard said one more rate hike would likely cover the Fed to 2018.
Access Our Free Q4 Dollar Outlook As The Fed Appears Cornered Regarding Effective Monetary Policy
Despite uncertainty about how steep the slope of rate hikes will be from the Fed (most of the smart money is on a very low slope), one market that continues to rise is international USD borrowing costs. The 3-month London Interbank Overnight Offer Rate [LIBOR] has recently traded at the highest level since May 2009, and continued elevation may keep the USD supported despite looking stretched on technical studies shown below.
D1 DXY Index Chart / Sharp Reversal Appears Able To Surmount Resistance
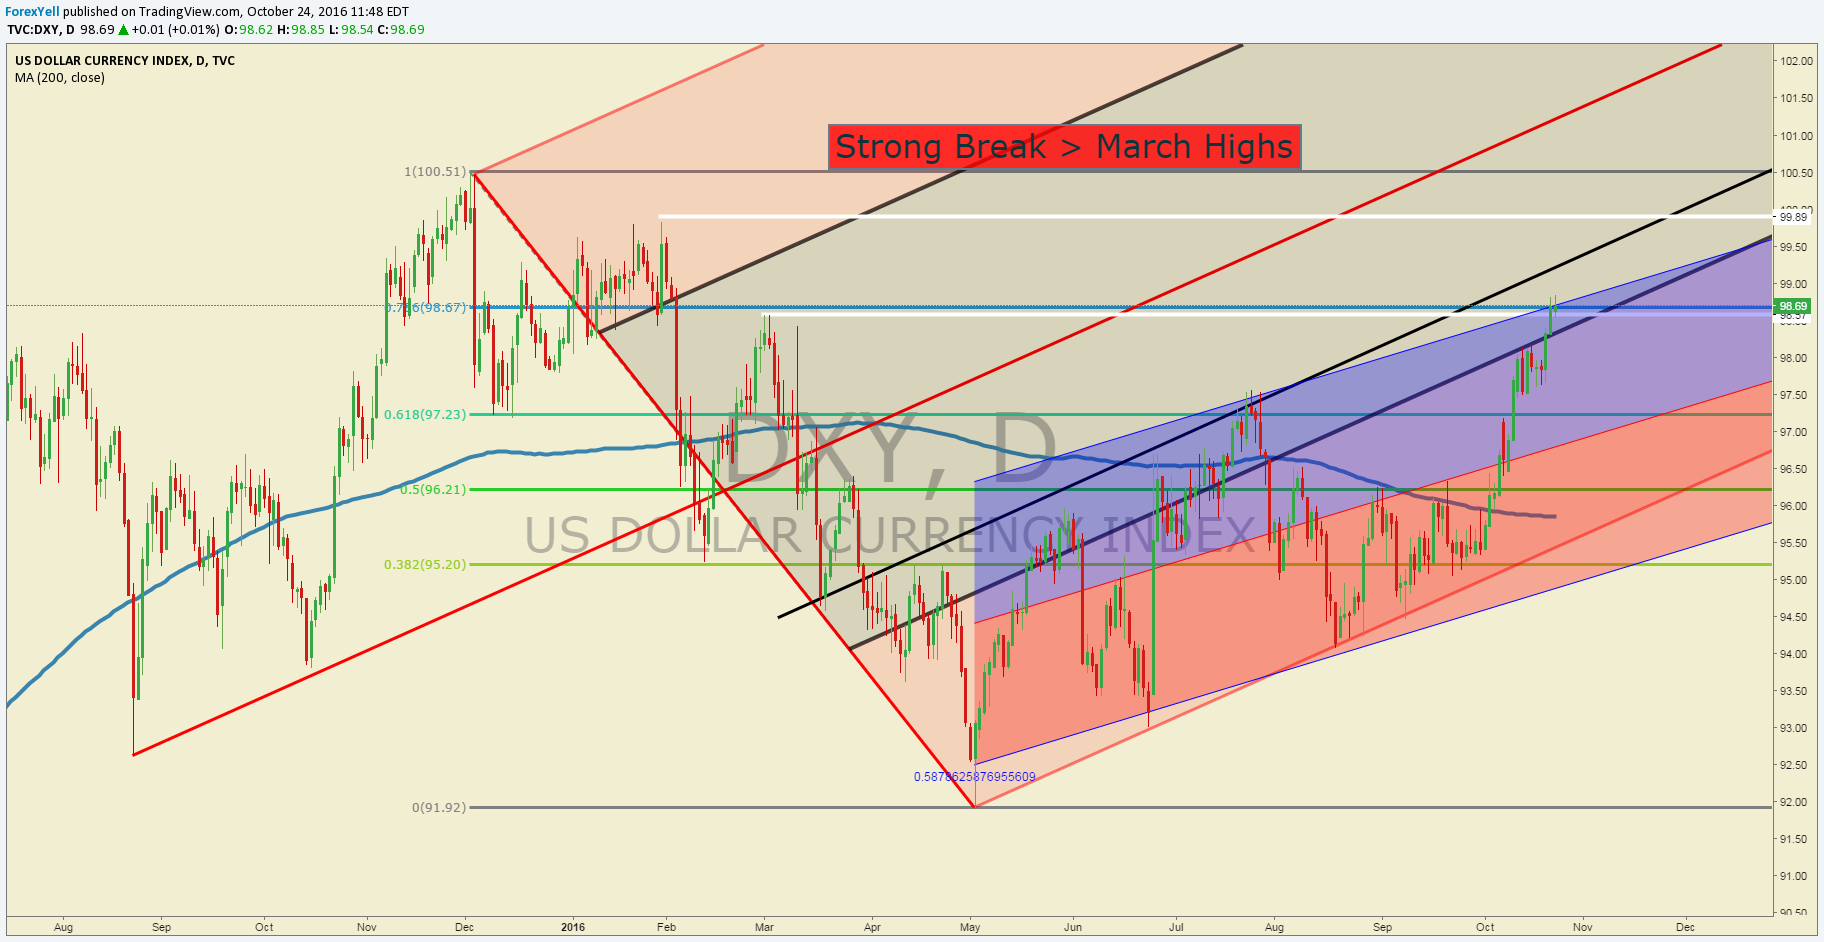
The run-up in USD that begin before Jaxson Hole has taken less than 50 trading days and has propelled the DXY nearly 5%. The chart above shows two channels worth watching. The tighter channel is a regression channel, which provides a least-squares regression line in addition to an equidistant support and resistance line based on extreme closes from the regression line.
The price on October 24 is trading outside of the regression channel, which seems unsustainable given the rather lower currency market volatility as measured by the Deutsche Bank CVIX or Currency Volatility Index.
A similar move higher was seen in the US Dollar when it rebounded from a 17-month low before the EU Referendum. The move occurred from May 3 through July 25 or 59 trading days, and the US Dollar saw a 5.79% increase before retracing 61.8% of the rally.
While the current move appears stretched, it is not worth fighting given the weakness of the DXY counterparts. Many traders like to catch a turn or sell at a top, but it would be better to see a turnaround developing before jumping on board. A key level that should be watched for a possible multi-percentage retracement would be a breakdown below 94.54 where there was consolidation in the DXY in mid-October as well as the July 25 high.
Even if a retracement arrives, traders would still do well to keep their sights on further upside. Regardless of low volatility, the trend slope remains positive with fundamental support due to weakness in DXY counterparts.
Shorter-Term DXY Technical Levels for Monday, October 24, 2016
For those interested in shorter-term levels of focus than the ones above, these levels signal important potential pivot levels over the next 48-hours of trading.

T.Y.


