


To receive Ilya's analysis directly via email, please SIGN UP HERE
Talking Points:
- US Dollar Technical Strategy: Holding Long via Mirror Trader Basket **
- Support: 11878, 11737, 11688
- Resistance:11965, 12107, 12221
The Dow Jones FXCM US Dollar Index broke a five-week range to extend to the highest level in over six years. A daily close above the 23.6% Fibonacci expansion at 11965 exposes the 38.2% level at 12107. Alternatively, a turn below the 11854-78 area (March 2009 high, 14% Fib) clears the way for a test of the February 26 low at 11737.
We remain broadly bullish on the US Dollar against its leading counterparts in line with our long-term fundamental outlook. As such, we remain long via the Mirror Trader US Dollar currency basket.
Add these technical levels directly to your charts with our Support/Resistance Wizard app!
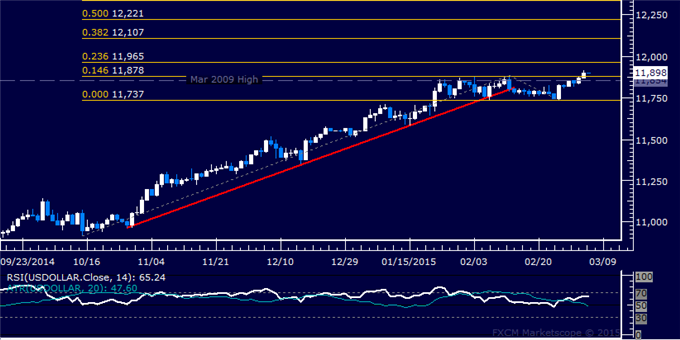
Daily Chart - Created Using FXCM Marketscope
** The Dow Jones FXCM US Dollar Index and the Mirror Trader USD basket are not the same product.
--- Written by Ilya Spivak, Currency Strategist for DailyFX.com


