


To receive Ilya's analysis directly via email, please SIGN UP HERE
Talking Points:
- US Dollar Technical Strategy: Holding Long via Mirror Trader Basket **
- Support: 11740, 11653, 11513
- Resistance:11791, 11888, 11983
The Dow Jones FXCM US Dollar Index continues to look vulnerable as a bearish Evening Star and negative RSI divergence warn of oncoming losses. A daily close below 11740-86 area marked by a rising trend line and the 14.6% Fibonacci retracement exposes the 23.6% level at 11653. Alternatively, a break above the 11854-76 zone (March 2009 high, 14.6% Fib expansion) opens the door for a challenge of the 23.6% threshold at 11963.
We remain broadly bullish on the US Dollar against its leading counterparts in line with our long-term fundamental outlook. As such, we remain long via the Mirror Trader US Dollar currency basket.
Add these technical levels directly to your charts with our Support/Resistance Wizard app!
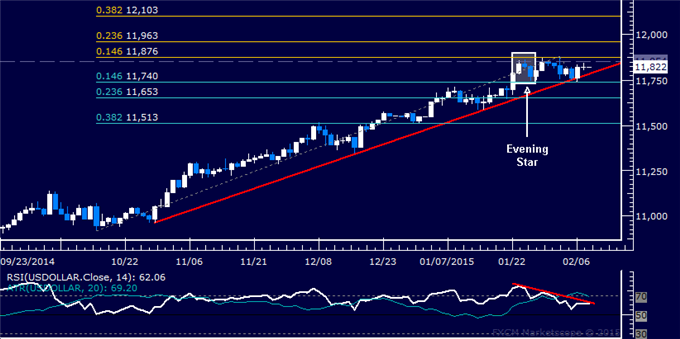
Daily Chart - Created Using FXCM Marketscope
** The Dow Jones FXCM US Dollar Index and the Mirror Trader USD basket are not the same product.
--- Written by Ilya Spivak, Currency Strategist for DailyFX.com


