


Talking Points
- The FTSE 100 is lower over the last 24 hours and is nearing the lower end of the 6054 to 6182 range.
- Breaching the lower end of the 6054 to 6182 range may affect the longer-term trend, which has been bullish since February.
- The lower FTSE 100 appears to be an adjustment to Asian Stock markets, which traded lower in the overnight session.
The FTSE 100 was, at the time of writing, nearing the lower end of the 6054 to 6182 range. The 6054 level is last Friday’s low and an important level for the longer-term trend.
The longer-term trend, which has been in place since February, is bullish above last week’s low, as it is the most recent swing low of this upward trend. Below Friday’s low of 6054, the next support level is the March 10 low of 6006 and is followed by a much lower low, the February 24 low of 5841.
While the potential implications for this longer-term trend on a slide below the 6054 low are important, we note that the 6054 to 6182 range was intact at the time of writing and that it is common for the markets to test both sides of a range. In other words, the FTSE 100 will remain range bound until it no longer falls into this category. Resistance levels above Tuesday’s high of 6182 are the intraday high of 6210, formed in the afternoon of May 3, and the April 27 high of 6341.
Our Stock Market forecasts for Q2 2016 are now live on the site. Download them for free.
FTSE 100 | CFD: UK100
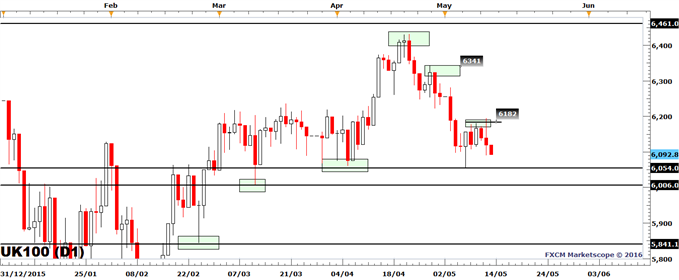
Created with Marketscope/Trading Station II; prepared by Alejandro Zambrano
The bearish bias to the FTSE 100 could be the fact that the index is catching up with overnight declines in Asian stock markets. The Asian stock markets did in turn adjust *lower as they adapted to U.S. stock markets and U.S. Jobless Claims, the latter rising to a one year high, reaching 294k vs. a 270k expected. Higher levels of Jobless Claims suggest that the labor market is doing less good than expected. We note that it is a weekly indicator and that one week of bad data does not necessarily indicate the start of a new trend.
This morning, German first-quarter GDP numbers rose by 0.7% QoQ from 0.3%. The outcome was higher than the 0.6% expected by a Bloomberg News poll. However, the FTSE 100 has not paid attention to the news. Later today, Eurozone GDP is on deck and expected to rise by 1.6% YoY from 1.5%. This may have some impact on the FTSE 100. For an update on upcoming U.S. data releases, please see today’s update by Ilya Spivak, Currency Strategist.
Created with Marketscope/Trading Station II; prepared by Alejandro Zambrano
--- Written by Alejandro Zambrano, Market Analyst for DailyFX.com
Contact and follow Alejandro on Twitter: @AlexFX00


