Nasdaq 100 Technical Outlook:
- Nasdaq 100 is trading back inside long-term upward channel
- Break back inside a long-term channel points to move to 10k
- Need to see panic-selling before a low is in place


The Nasdaq 100 and by extension the whole market is in trouble
The Nasdaq 100 has long been the leader with the market darlings running the show in this index. I’m referring to the group of stocks known as FANMAG or FAANG, and throw in TSLA as well. These stocks (Facebook, Apple, Netflix, Microsoft, Amazon, Google, and Tesla) make up nearly half of the NDX’s composition.
As these stocks go goes the Nasdaq 100 and by extension the entire U.S. market, and the world for that matter given the U.S. stock market alone makes up more than half the entire global market cap. When you start looking at it this way, watching how this highly influential bunch of stocks behaves is crucial to better understanding how the market might perform.
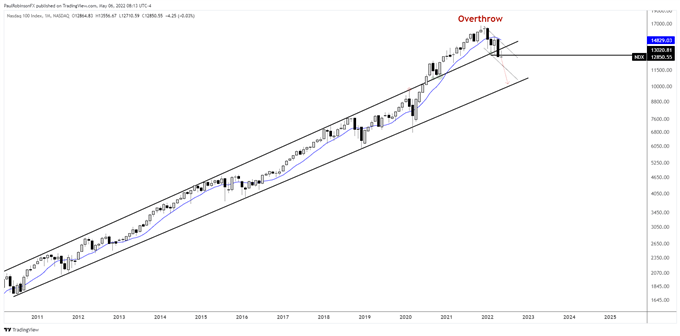
The chart below is one I’ve posted at various times over the years, noting it as a guide, and thus far it has done a good job of acting as a reliable compass. The bull market channel on the weekly/monthly extends from 2010 with each side of it acting as support and resistance at various times.
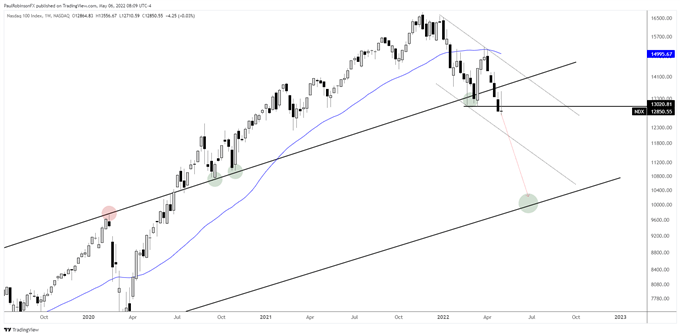
For the longest time price was contained neatly within the channel’s two lines until price escaped its gravity and started to trade above it back in July 2020. Once broken it was tested and validated as support twice within the few months following the breakout. It was once again validated as support here not too long ago during the Feb/March meltdown.
But with the close of May we saw a monthly closing print below the lows of the Feb/March tests, and on that price is once again trading back inside the channel for the first time since the middle of 2020. The overthrow is over.
Why does this matter so much? Because when a channel or range structure is broken and then price reverses back inside of it, it signals a significant likelihood that we will see the other side of the structure tested, and possibly exceeded. Looking at the best case should this scenario play out, a decline to around 10k could be in store in the months ahead.
Something that has been missing from this run of equity weakness is a vol event that signals a significant low. There has been no real panic selling. Given that the high 30s in the VIX has become a common stopping point for minor lows, it would seem a spike to the 50-60+ area is in store before a big low is seen in stocks.
But before we get ahead of ourselves on how the VIX is behaving, the big highlight at this time is the confirmed breach in the Nasdaq 100 that puts it at very high risk of undergoing a much larger sell-off in the weeks and months ahead.
Nasdaq 100 Monthly Chart

Nasdaq 100 Weekly Chart

Nasdaq 100 Charts by TradingView
Resources for Forex Traders
Whether you are a new or experienced trader, we have several resources available to help you; indicator for tracking trader sentiment, quarterly trading forecasts, analytical and educational webinars held daily, trading guides to help you improve trading performance, and one specifically for those who are new to forex.
---Written by Paul Robinson, Market Analyst
You can follow Paul on Twitter at @PaulRobinsonFX


