


Dow Jones & S&P 500 Highlights:
- S&P 500 trading near the 200-day, March 6 gap
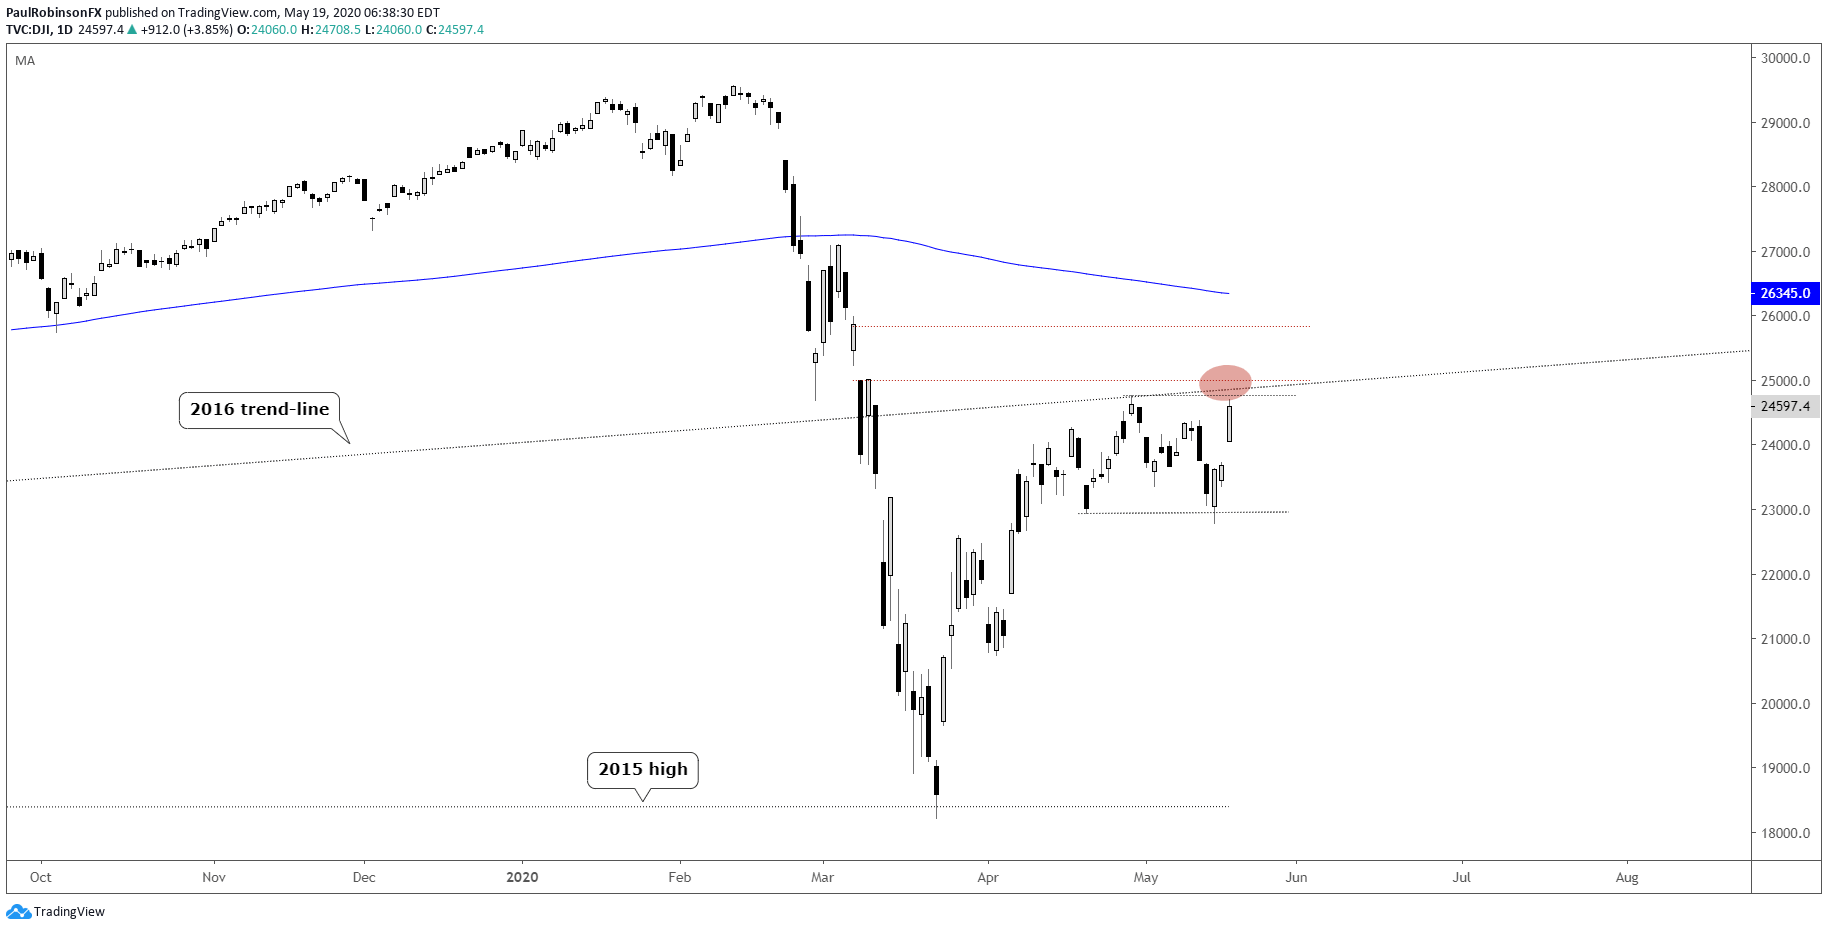
- Dow Jones back up against the underside of 2016 trend-line
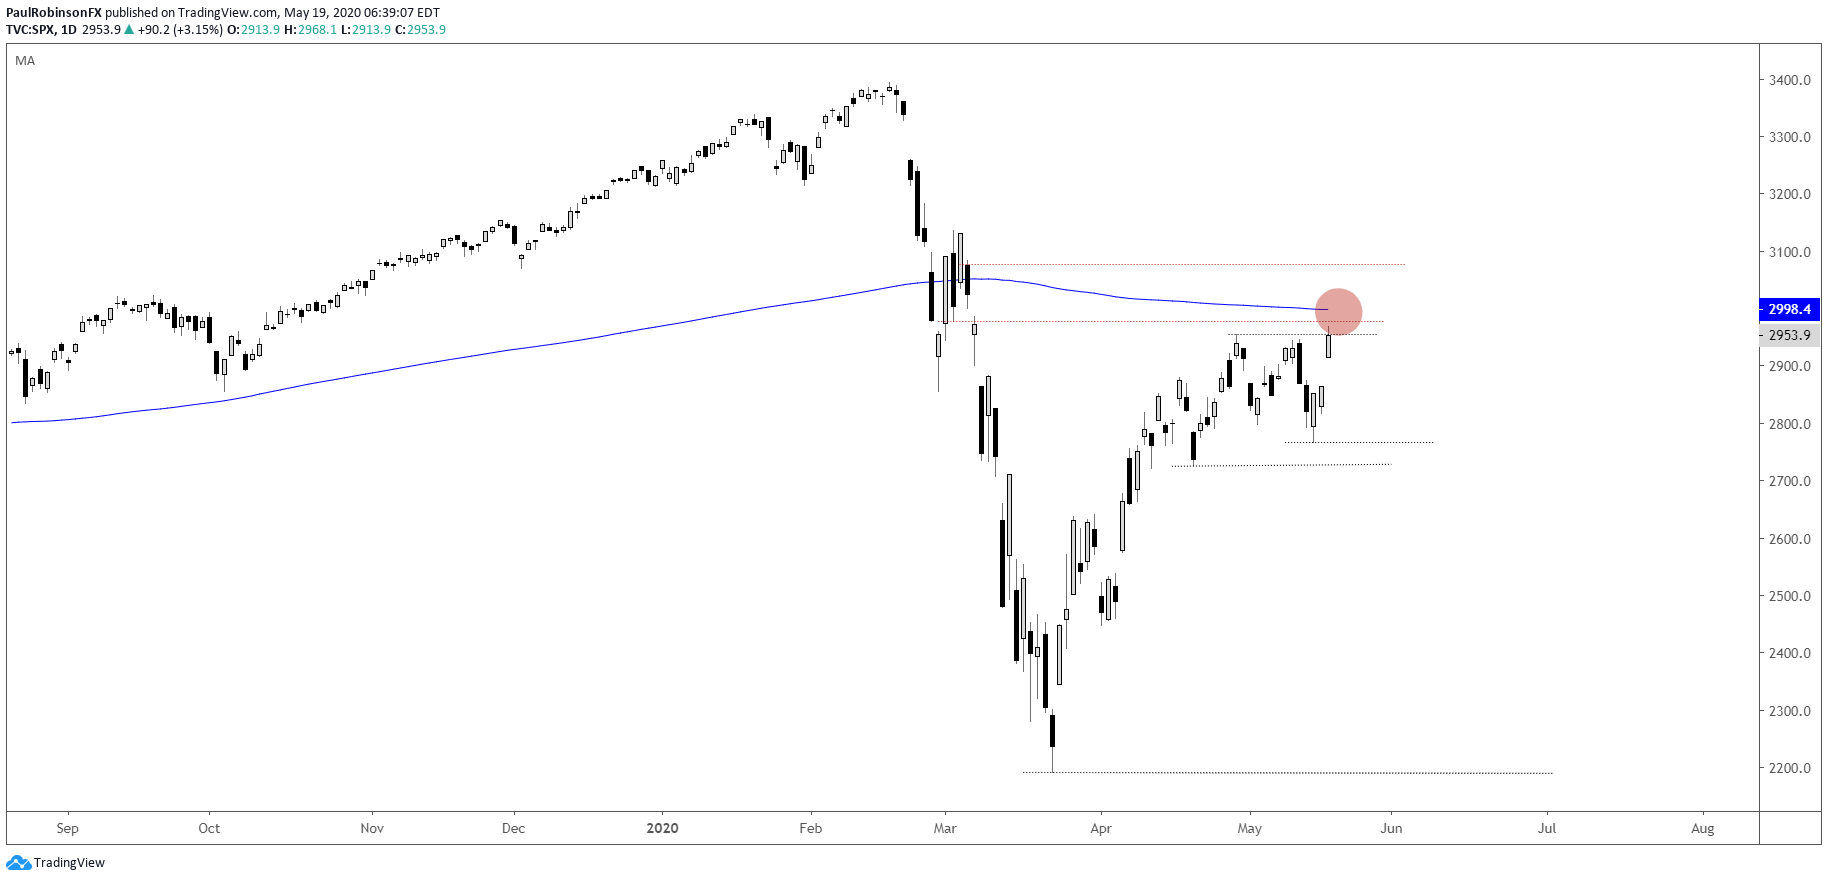
S&P 500 trading near the 200-day, March 6 gap
The S&P 500 opened the week on a strong note, pushing it above the recent highs carved out at the end of last month. The pop also has the 200-day MA coming into play, which could bring in a bit of volatility as it is tested for the first time since breaking at the end of February.
Watching how price action plays out here will be important in determining whether a ceiling will be put into place around the widely-watched moving average, or whether perhaps the S&P can impressively continue its recovery from the March panic low.
A hard turn down here soon would be indication that at the least we might see the area around 2760 hit again, the bottom of the recent range. A break through there could kick off a more meaningful decline, but we will again at that point need to closely monitor price action for further cues.
A strong breakout above 3k will put the S&P above the 200-day hurdle and have 3136 up next as a minor level of resistance, along with a potential move back to the highs. But before getting ahead of ourselves lets see how nearby resistance gets handled first. The thinking remains that we will see some type of downturn here shortly.

S&P 500 Daily Chart (trading around resistance)
The Dow Jones is back battling the underside of the 2016 trend-line and March 6/9 gap that also starts right around the 4-yr+ trend-line. The 200-day is a little ways higher, but with the S&P at the long-term average and the Dow at a significant trend-line/gap, it makes for an interesting point in time. Will it make or break?.
Dow Jones Daily Chart (underside of 2016 trend-line)
Resources for Forex Traders
Whether you are a new or experienced trader, we have several resources available to help you; indicator for tracking trader sentiment, quarterly trading forecasts, analytical and educational webinars held daily, trading guides to help you improve trading performance, and one specifically for those who are new to forex.
---Written by Paul Robinson, Market Analyst
You can follow Paul on Twitter at @PaulRobinsonFX


