


S&P 500 TECHNICAL OUTLOOK: NEUTRAL
- S&P 500 broke three-month resistance, rising to a record high
- Near-term chart setup warns a blow-off top may be in the works
- Confirmation of reversal needs break of October trend support
Get help building confidence in your AUD/USD strategy with our free trading guide!
The S&P 500 looks to have marked a critical break with a close above 3029.50. Besides putting the benchmark equities index at a record high, the move conspicuously overcame a potent resistance barrier capping upside progress since late July. The next upside barrier comes in at 3051.50, the 78.6% Fibonacci expansion. A break above that confirmed on a daily closing basis opens the way for a test of the 100% level at 3105.00.
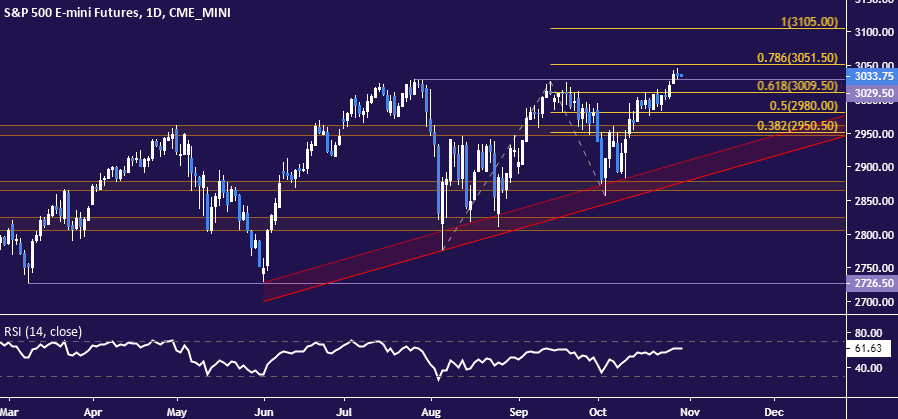
Daily S&P 500 chart created with TradingView
Turning to the four-hour chart for timelier near-term positioning warns against over-extrapolating the upside scenario however. It shows prices have put in a Bearish Engulfing candlestick pattern, a warning sign of possible topping in the works. That risk is compounded by the appearance of negative RSI divergence, which speaks to ebbing upside momentum and lends credence to the case for a reversal.

4-hour S&P 500 chart created with TradingView
Breaking below upward-sloping support establishing the uptrend from early-October lows is probably a prerequisite for bearish confirmation. Clearing that along with a block of nearby support levels running down through 3011.50 would make compelling the argument that a false topside breakout has been unwound, setting the stage for deeper losses. The next layer of immediate support lines up in the 2984-87 zone.
S&P 500 TRADING RESOURCES
- Just getting started? See our beginners’ guide for FX traders
- Having trouble with your strategy? Here’s the #1 mistake that traders make
- Join a free live webinar and have your trading questions answered
--- Written by Ilya Spivak, Currency Strategist for DailyFX.com
To contact Ilya, use the comments section below or @IlyaSpivak on Twitter


