S&P 500/Dow Jones Technical Highlights:
- S&P 500 is declining out of wedge, still has room to fall
- Dow Jones reversal-day was impressive but may not last
Check out the fundamental and technical forecast for stocks as they rise towards record highs in the Q2 Equity Markets Forecast.
S&P 500 is declining out of wedge, still has room to fall
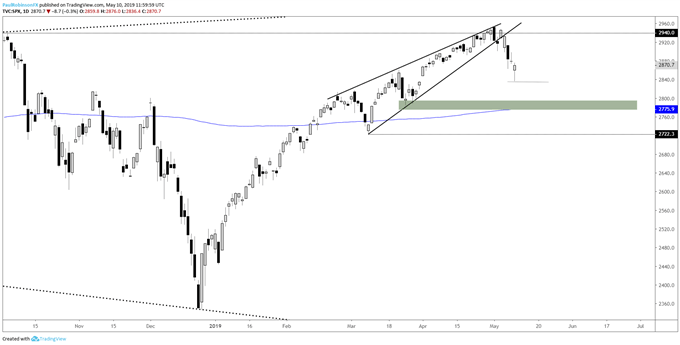
So far this week the S&P 500 has made good on declining from the rising wedge we’ve been focusing on the past couple of weeks. Yesterday’s turnabout day, though, does bring into notion the possibility of a pause in the decline at the least, possibly a rally.
However, if yesterday afternoon’s rally is not extended quickly then the risk becomes skewed towards strength being nothing more than an intra-day bounce; even a rally from here if not strong might still turn out to be nothing more than a short-lived bounce as the forces of the rising wedge are still present and downside projected targets have yet to be met.
A drop below 2836 will significantly increase the odds that the 200-day at 2775 or worse will be reached. A hold above yesterday’s low will at the least keep the market neutral if not turn it bullish.
Traders are generally short the S&P 500, find out on the IG Client Sentiment page what this could be for prices moving forward.
S&P 500 Daily Chart (Rising wedge potential still unfulfilled)

Dow Jones reversal-day was impressive but may not last
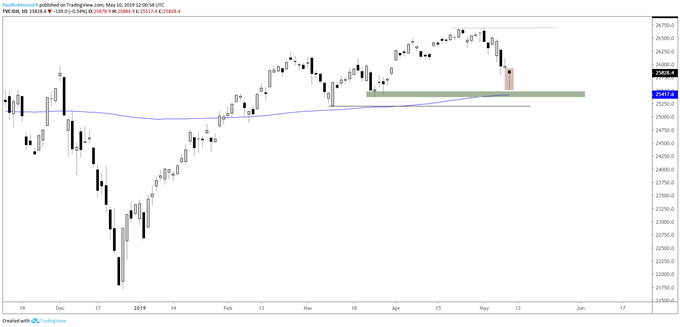
The Dow Jones posted an impressive reversal candlestick (‘pin bar’) yesterday just above the 200-day MA. If the S&P goes on to press lower towards its own 200-day then the Dow is likely to fall much further than the 200-day MA towards the 25208 low. But just as is the case with the S&P, hold onto the low and the outlook is neutral to potentially bullish.
Dow Jones Daily Chart (reversal-day, but can it hold?)

To learn more about U.S. indices, check out “The Difference between Dow, Nasdaq, and S&P 500: Major Facts & Opportunities.” You can join me every Wednesday at 10 GMT for live analysis on equity indices and commodities, and for the remaining roster of live events, check out the webinar calendar.
Tools for Forex & CFD Traders
Whether you are a beginning or experienced trader, DailyFX has several resources available to help you; indicator for tracking trader sentiment, quarterly trading forecasts, analytical and educational webinars held daily, trading guides to help you improve trading performance, and one specifically for those who are new to forex.
---Written by Paul Robinson, Market Analyst
You can follow Paul on Twitter at @PaulRobinsonFX


