New Zealand Dollar Technical Forecast:
- NZD/USD breaches above 200-week moving average following RBNZ
- The psychological 0.6900 level stands as next level for the bulls to test
- Chinese economic data on tap may help propel the Kiwi higher this week
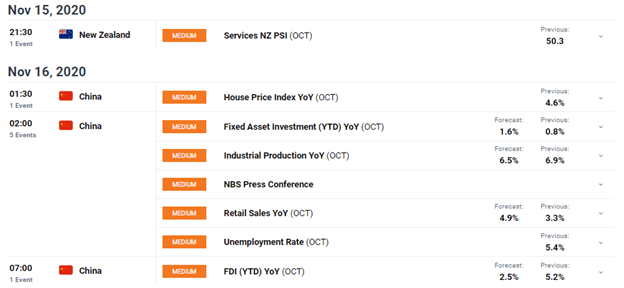
The New Zealand Dollar rose 1.10% versus the US Dollar last week. Upcoming economic data out of New Zealand and China may boost NZD/USD further. According to the DailyFX Economic Calendar, NZ Services PSI will cross the wires to start the week. Afterward, China will release figures on capital investment, industrial production, retail sales, FDI, and unemployment. Stronger than expected outcomes would likely be a tailwind for NZD strength this week.
DailyFX Economic Calendar

Source: DailyFX.com
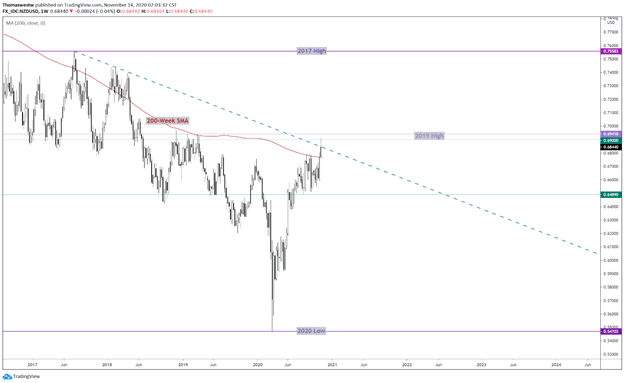
NZD/USD has seen a bullish run over the past two weeks, with prices hitting its highest level since March 2019. A testament to the pair’s recent strength has been the first breach of the 200-week moving average since early 2018. The Kiwi has rallied over 25% against the greenback since the March low, when Covid caused a rush to USD amid liquidity concerns. Now, a trendline from the 2017 high poses as resistance.
NZD/USD Weekly Chart

Chart created with TradingView
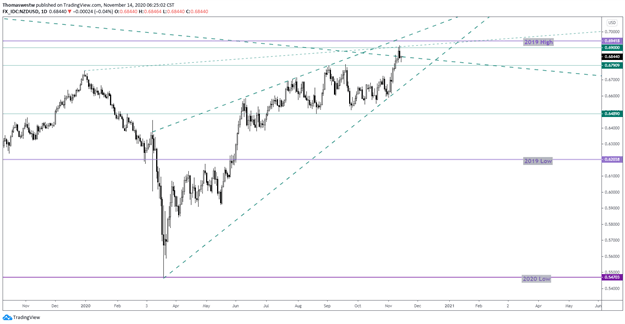
Zooming into the daily time frame highlights the current proximity of this barrier. If prices hold here, bulls will probably look to test the 0.6900 level. Above, the 2019 high sits at 0.6941. These psychologically important price levels, if overtaken, would put the Kiwi near the top of an ascending wedge carved out since the beginning of the year.


To the downside, NZD/USD would look to see support around the September intraday high at 0.6790, a prior area of resistance from late 2019. Any bearish drive would need to see this level broken in a decisive manner for follow-through. The reason being, since the March lows, price action has formed a well-defined rising wedge. That, along with the rising 20- and 50-day moving averages providing support on the downside, would pose a key area of support.
NZD/USD Daily Price Chart

Chart created with TradingView
NZD/USD TRADING RESOURCES
- Just getting started? See our beginners’ guide for FX traders
- What is your trading personality? Take our quiz to find out
- Join a free webinar and have your trading questions answered
--- Written by Thomas Westwater, Analyst for DailyFX.com
To contact Thomas, use the comments section below or @FxWestwater on Twitter


