


NZD/USD Technical ANALYSIS: BEARISH
- New Zealand Dollar eyes resistance below 0.61 again as prices rebound
- 4-hour chart shows negative RSI divergence, warns upswing may fizzle
- Trader sentiment studies tip bearish bias, but a pivot might be brewing
The New Zealand Dollar attempted to extend lower against its US counterpart after producing a somewhat rare Three Black Crows candlestick pattern (as expected). The move was cut short near support marked by the 23.6% Fibonacci expansion at 0.5833 however, giving way to recovery that has brought the pair back toward its near-term swing high at 0.6069.
This is a pivotal juncture. Breaking above it with confirmation on a daily closing would invalidate the latest attempt at downtrend resumption. Extension upward to retest support-turned-resistance in the 0.6197-0.6245 zone may follow. Alternatively, a turn back lower that brings NZD/USD below 0.5833 probably sees the next inflection point at 0.5690, the 38.2% Fib level.
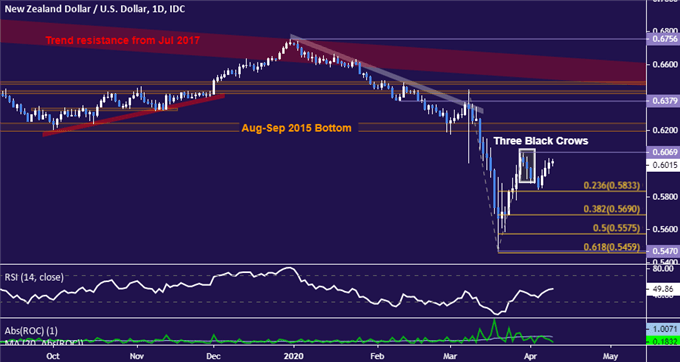
NZD/USD daily chart created using TradingView
The latter scenario finds some support in near-term positioning. The four-hour chart reveals negative RSI divergence as prices hover near resistance, hinting at ebbing upside momentum. That may set the stage for a downturn, although making the case for follow-through probably calls for a break of rising trend line support guiding the upswing over the past week.
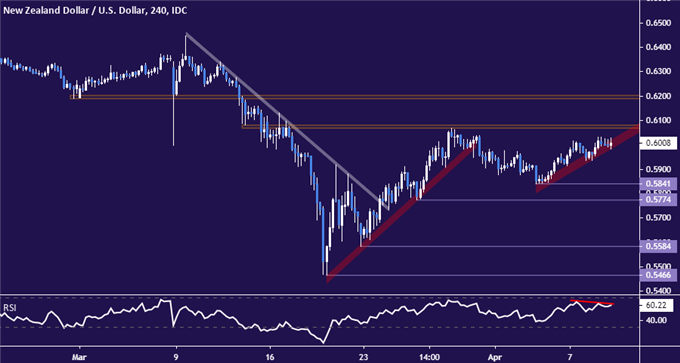
NZD/USD 4-hour chart created using TradingView

NZD/USD TRADER SENTIMENT
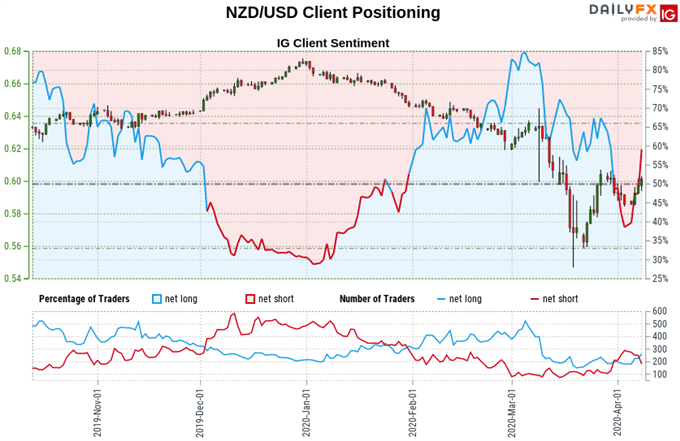
Retail sentiment data shows 54.48% of traders are net-long, with the long-to-short ratio at 1.20 to 1. IG Client Sentiment(IGCS) is typically used as a contrarian indicator, soretail traders being net-long suggests that NZD/USD is biased downward. The skew has narrowed a bit over the past day however. Continued evolution in this direction over the coming days may suggest that a pivot in the trend is brewing.
See the full IGCS sentiment report here.

NZD/USD TRADING RESOURCES:
- Just getting started? See our beginners’ guide for FX traders
- Having trouble with your strategy? Here’s the #1 mistake that traders make
- Join a free live webinar and have your trading questions answered
--- Written by Ilya Spivak, Currency Strategist for DailyFX.com
To contact Ilya, use the Comments section below or @IlyaSpivak on Twitter


